
SaaS valuation, weekly recap
A deep dive into Forward EV/Sales, EV/Gross Profit, PSG, P/E, Rule-of-40 and shareholders Dilution — analyzing how growth, efficiency, market expectations shape valuations across the SaaS landscape.

Each week, I’ll publish a recap breaking down the key valuation metrics across the SaaS sector, highlighting where growth, efficiency, and market expectations intersect.
This week, the key event was Nvidia’s quarterly report. Despite very strong results — analyst expectations for Q1 revenue were beaten by 4.0%, and expectations for Q2 guidance were beaten by 4.7%, which implies further acceleration of revenue growth to +103.7% YoY if Nvidia delivers a similar beat in Q2 — NVDA shares fell 1.26%.
On one hand, this suggests that such high growth is already largely priced into the stock. On the other hand, it indicates that AI expansion and AI-related demand are not exceeding expectations, which is actually positive for SaaS companies because it contradicts the narrative that AI is destroying SaaS business models.
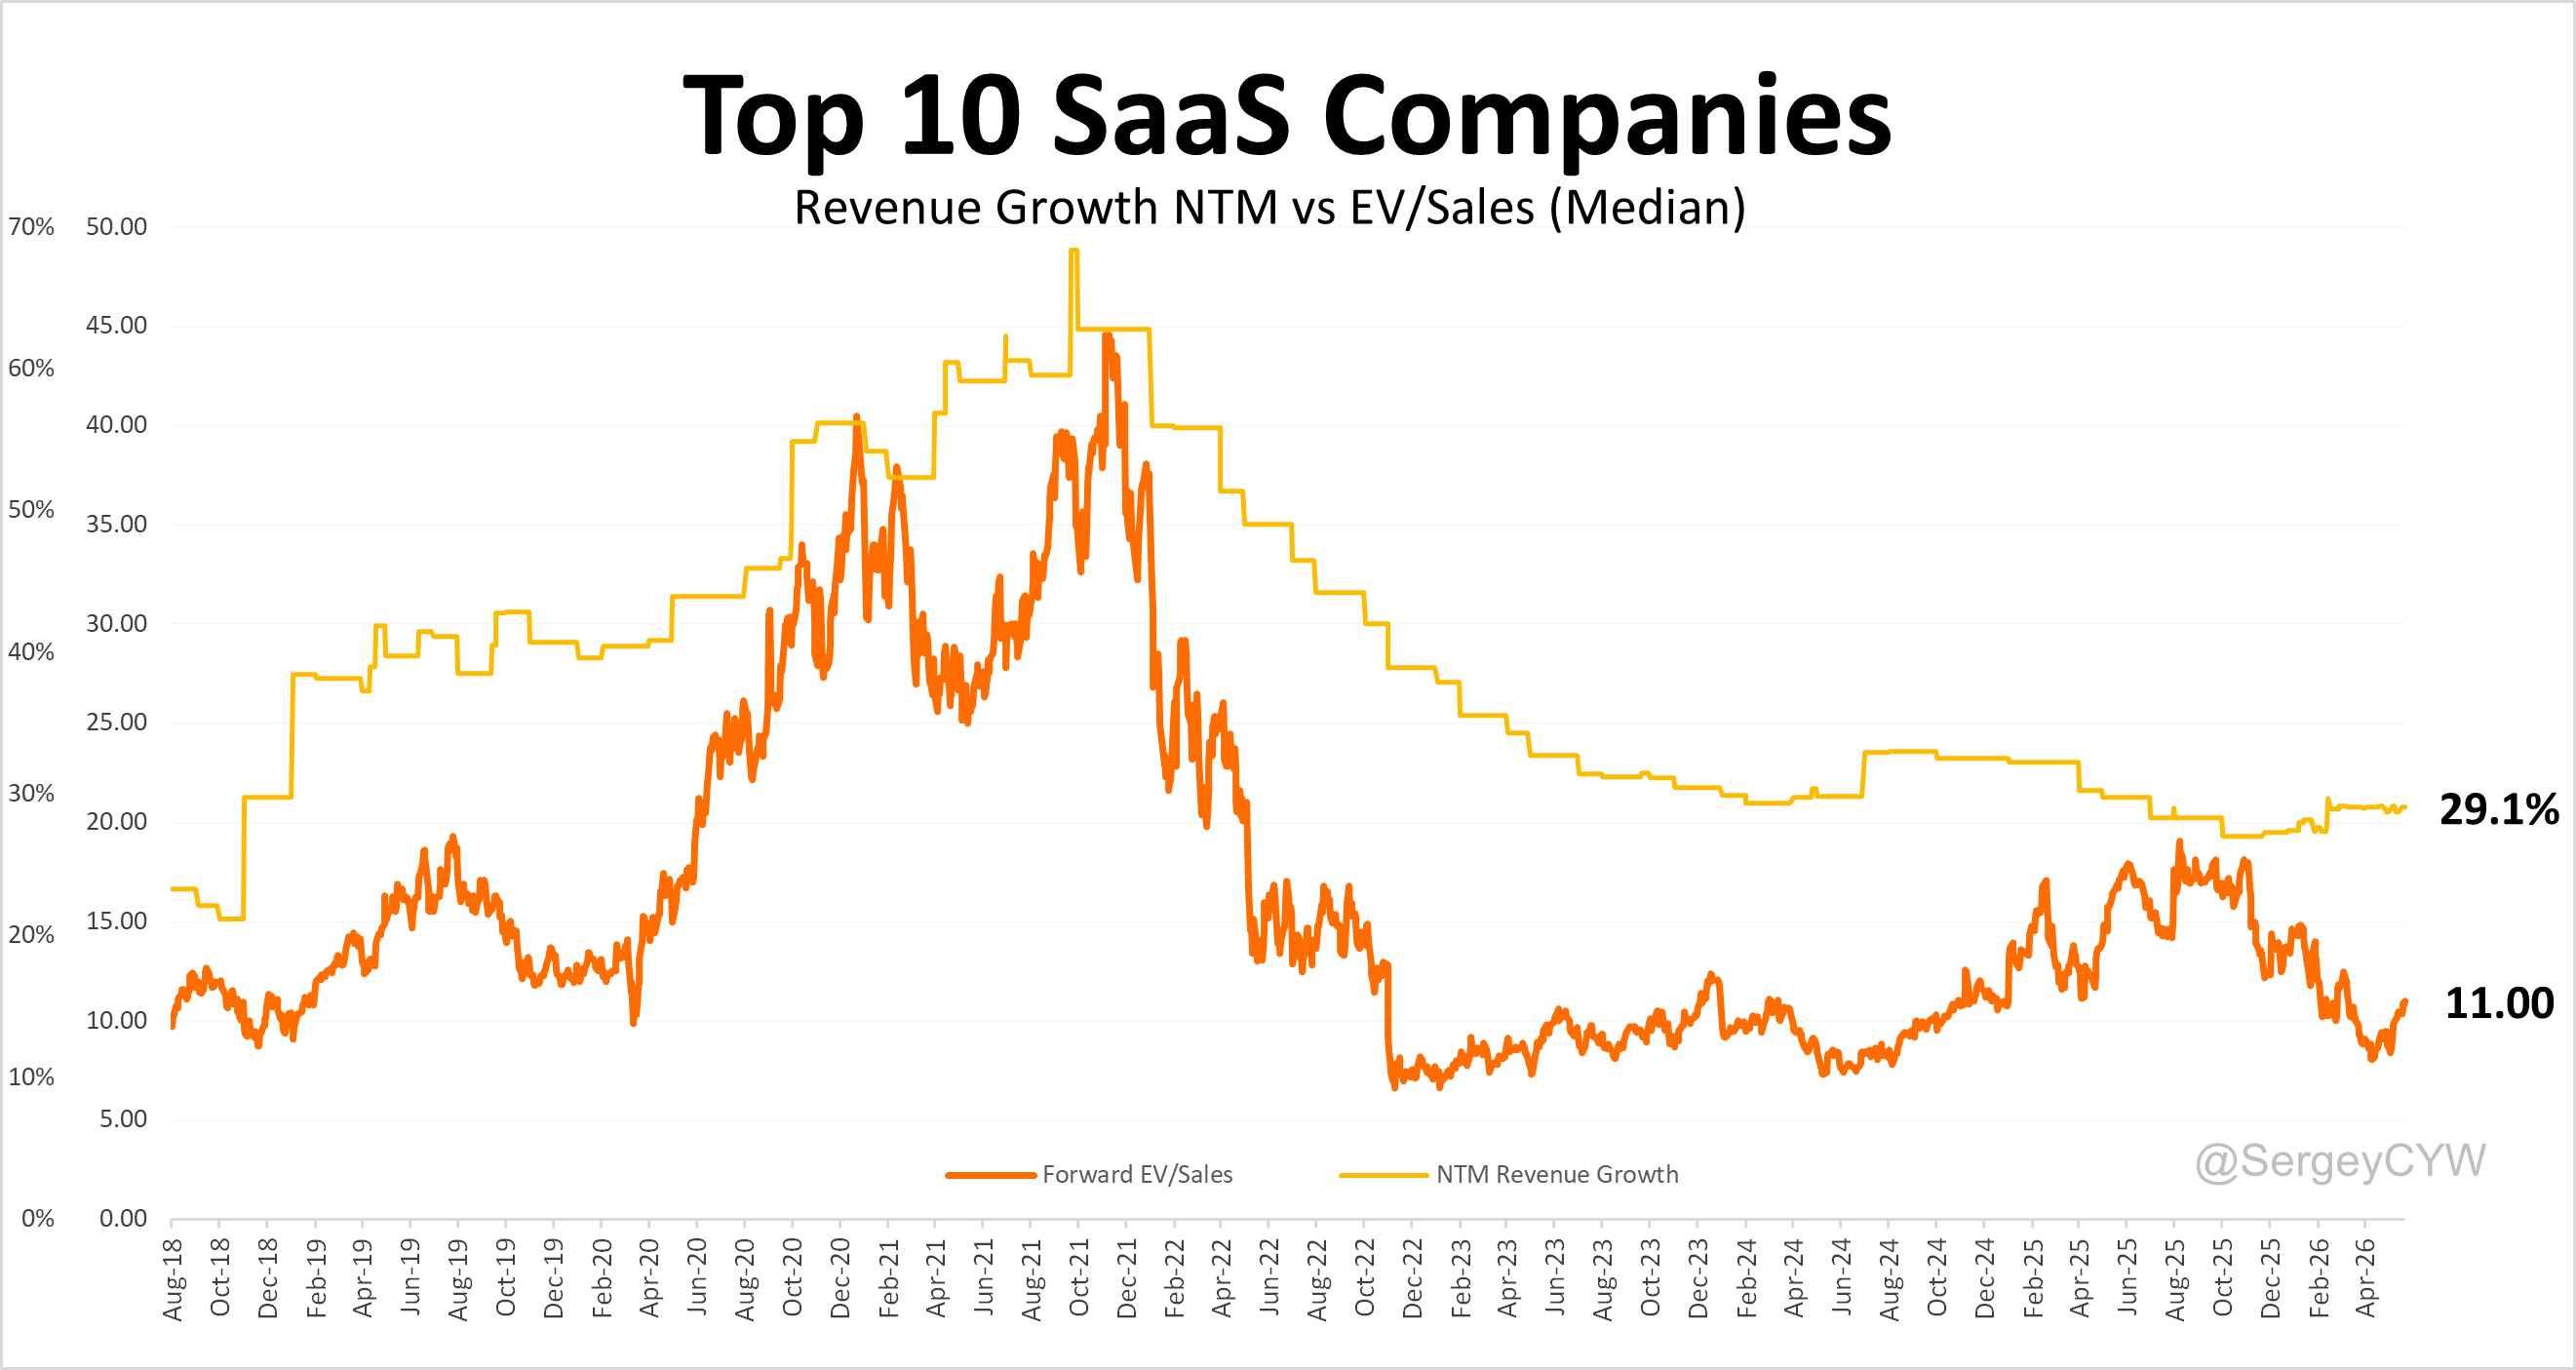
I believe the peak of the “Saaspocalypse” negativity has already been reached and passed (this assumes that we do not see another breakthrough comparable to the announcement of Agentic AI). Although valuation multiples for seat-based SaaS are still near historical lows — and this SaaS model is indeed more vulnerable to AI-related pressure — the multiple for the top 10 SaaS companies has already recovered to around 11x.
The market is gradually and selectively pricing in the idea that software companies will monetize AI rather than become victims of it, and I believe this trend will continue.
Next week, quarterly reports from Zscaler, Salesforce, Snowflake, MongoDB, and SentinelOne will be especially important. Their results should help show whether these companies are becoming victims of AI disruption or successfully monetizing AI adoption.
Table of Contents
Forward EV/Sales vs. NTM Estimated Revenue Growth (current and historical chart), including the top 10 fastest-growing SaaS companies
Forward EV/Gross Profit vs. NTM Revenue Growth
PSG (Price/Sales/Growth) — current and historical chart
Forward P/E vs. NTM Revenue Growth
Rule of 40
Rule of 40 vs. Forward EV/S Multiple
Pricing models (Seat-Based vs. Consumption and other Subscription models)
Dilution (SBC/Revenue and Outstanding share growth)
Forward EV/Sales to NTM Revenue Growth
SaaS companies are typically valued by comparing their EV/Sales multiple to their projected NTM (next twelve months) revenue growth. Forward revenue expectations matter: they give investors a clearer view of the company’s future potential rather than its trailing performance.
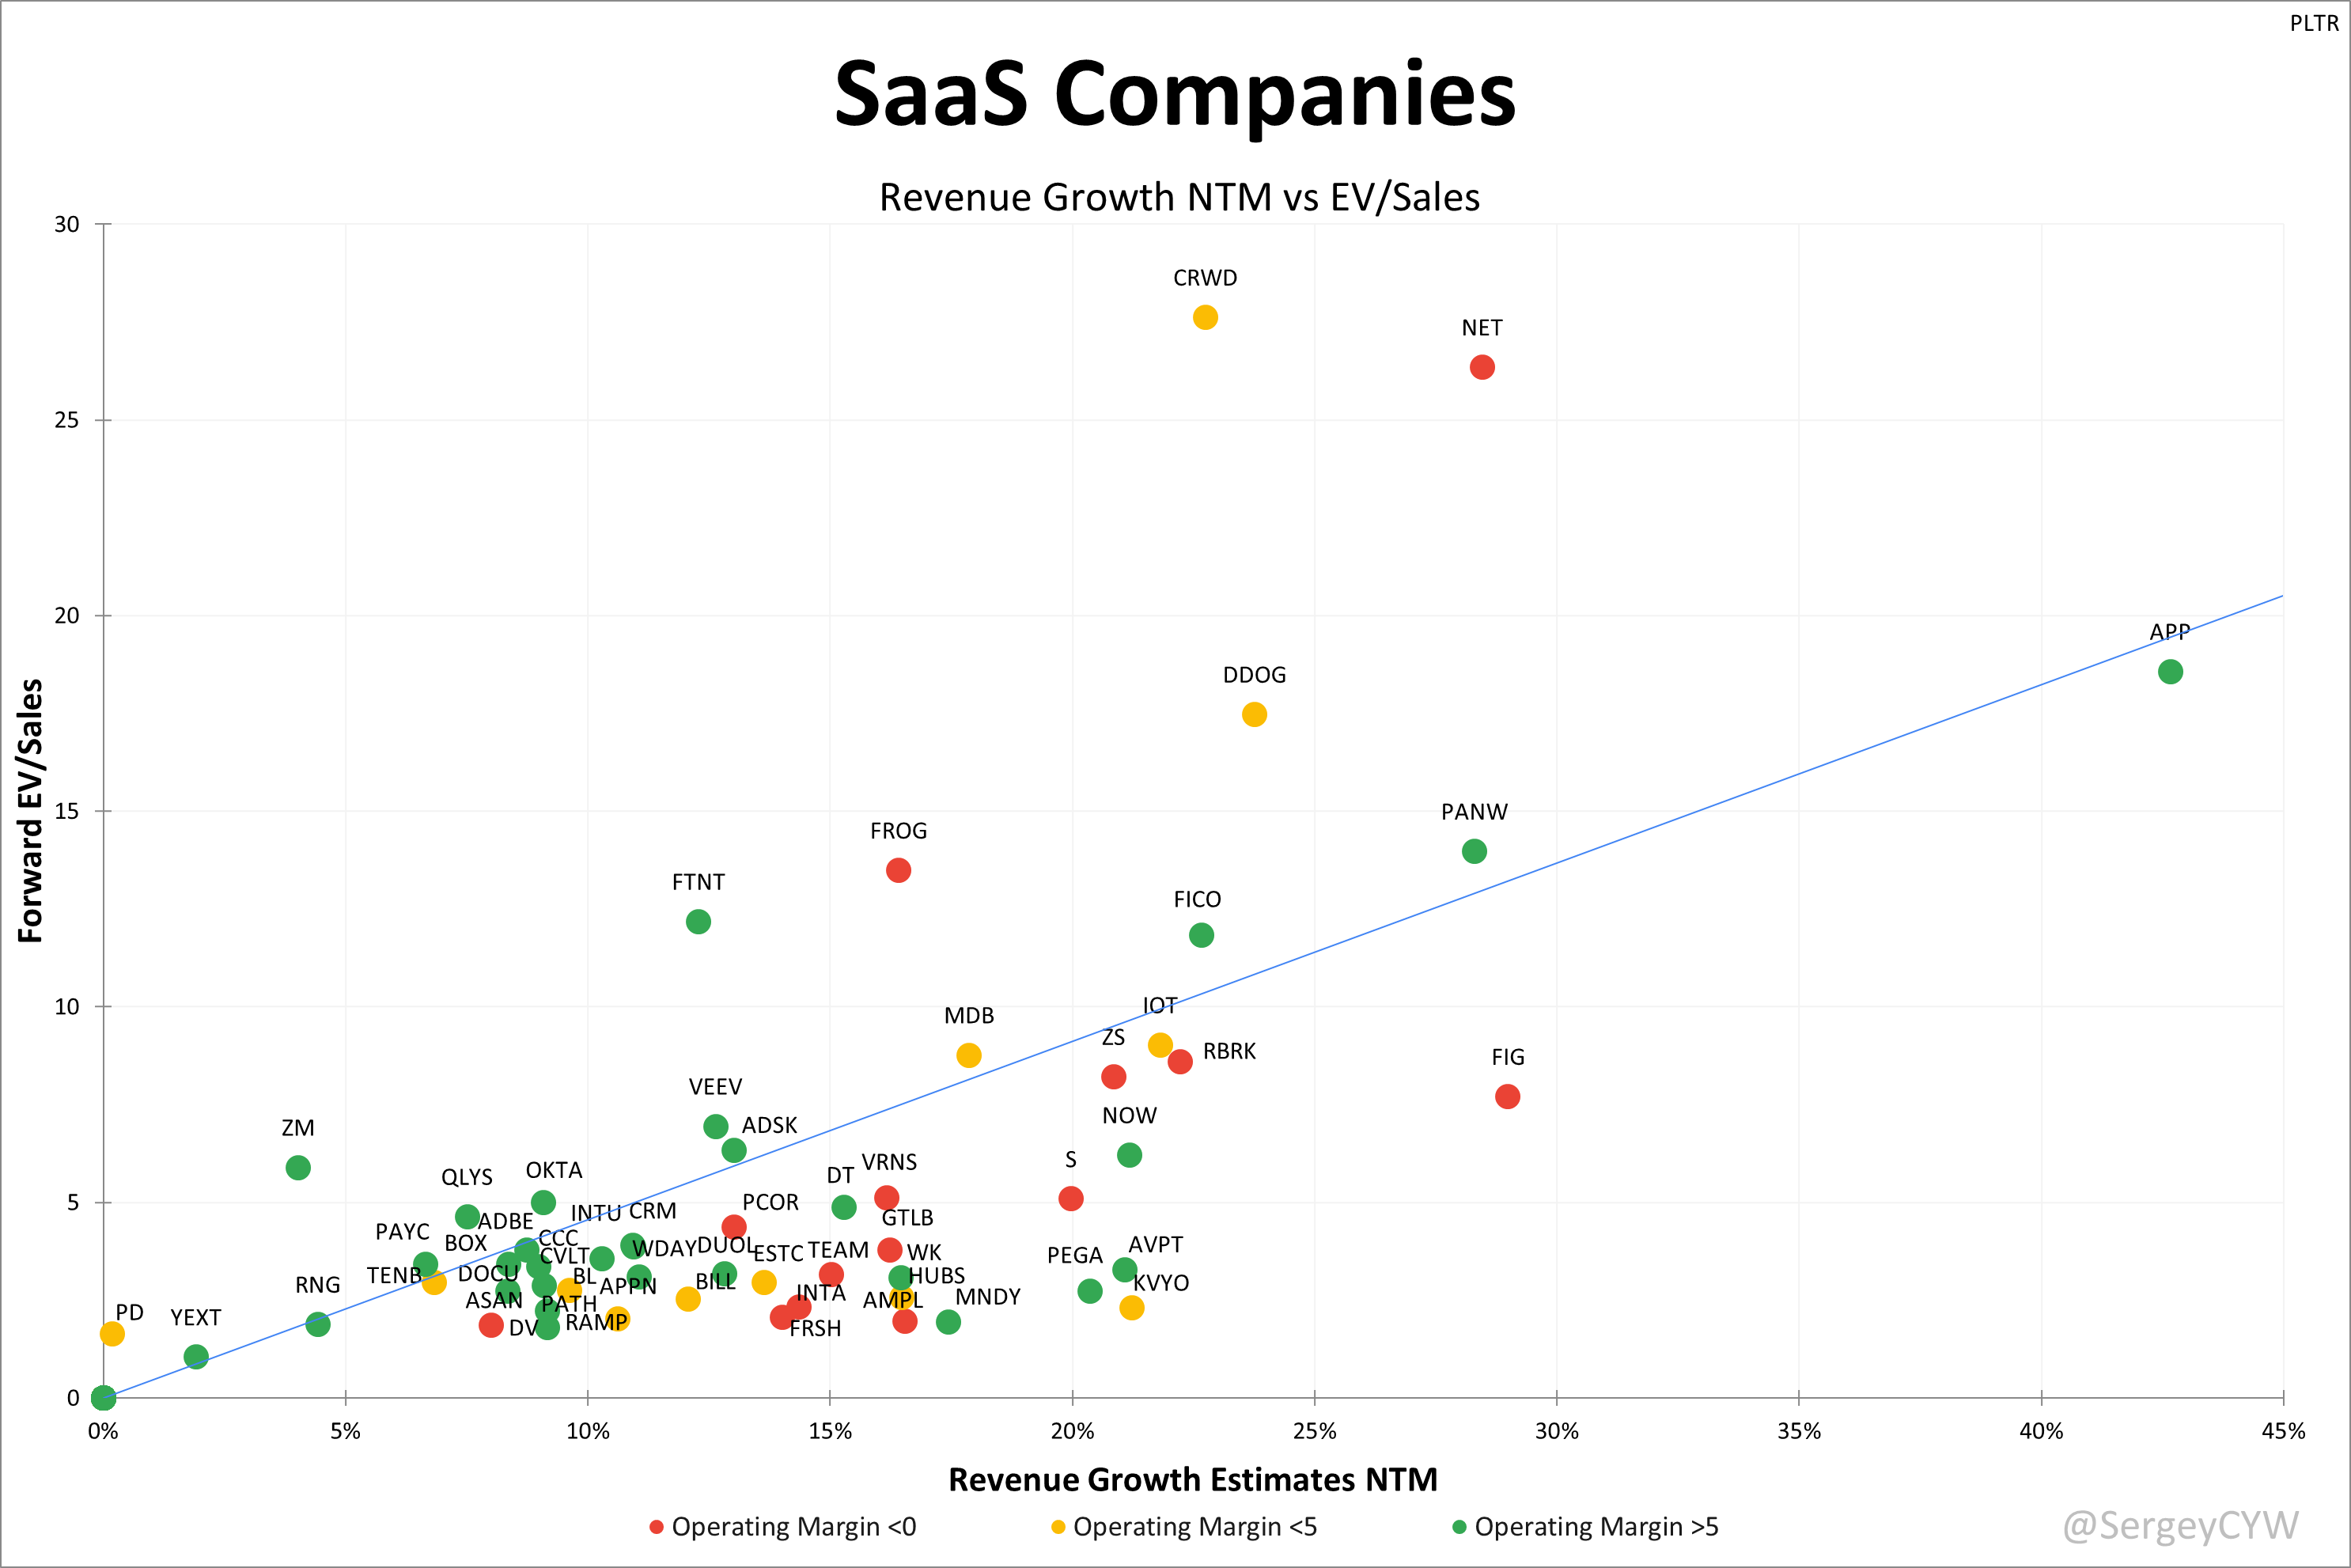
Note: For readability, $PLTR was excluded, as it currently trades at an Forward EV/Sales of 38.2 and +63.1% estimated Growth Rate. The chart includes software companies with an enterprise value above $1B and gross margins over 70%.
To provide deeper valuation context, I also include Operating Margin across the EV/Sales, EV/Gross Profit, and Rule of 40 charts. Operating profitability directly influences valuation — companies with sustained positive margins deserve higher multiples than those operating at a loss.
On the charts:
Red: Negative operating margin
Yellow: Operating margin below 5%
Green: Operating margin above 5%
In this case, I used the GAAP Operating Margin from the most recent quarter. This highlights the latest trends and helps identify companies that have recently achieved operating profitability. However, for seasonal businesses, this data may be distorted.
The median EV/Sales for SaaS companies stands at 3.79, with analyst-estimated NTM revenue growth of 14.1% YoY.
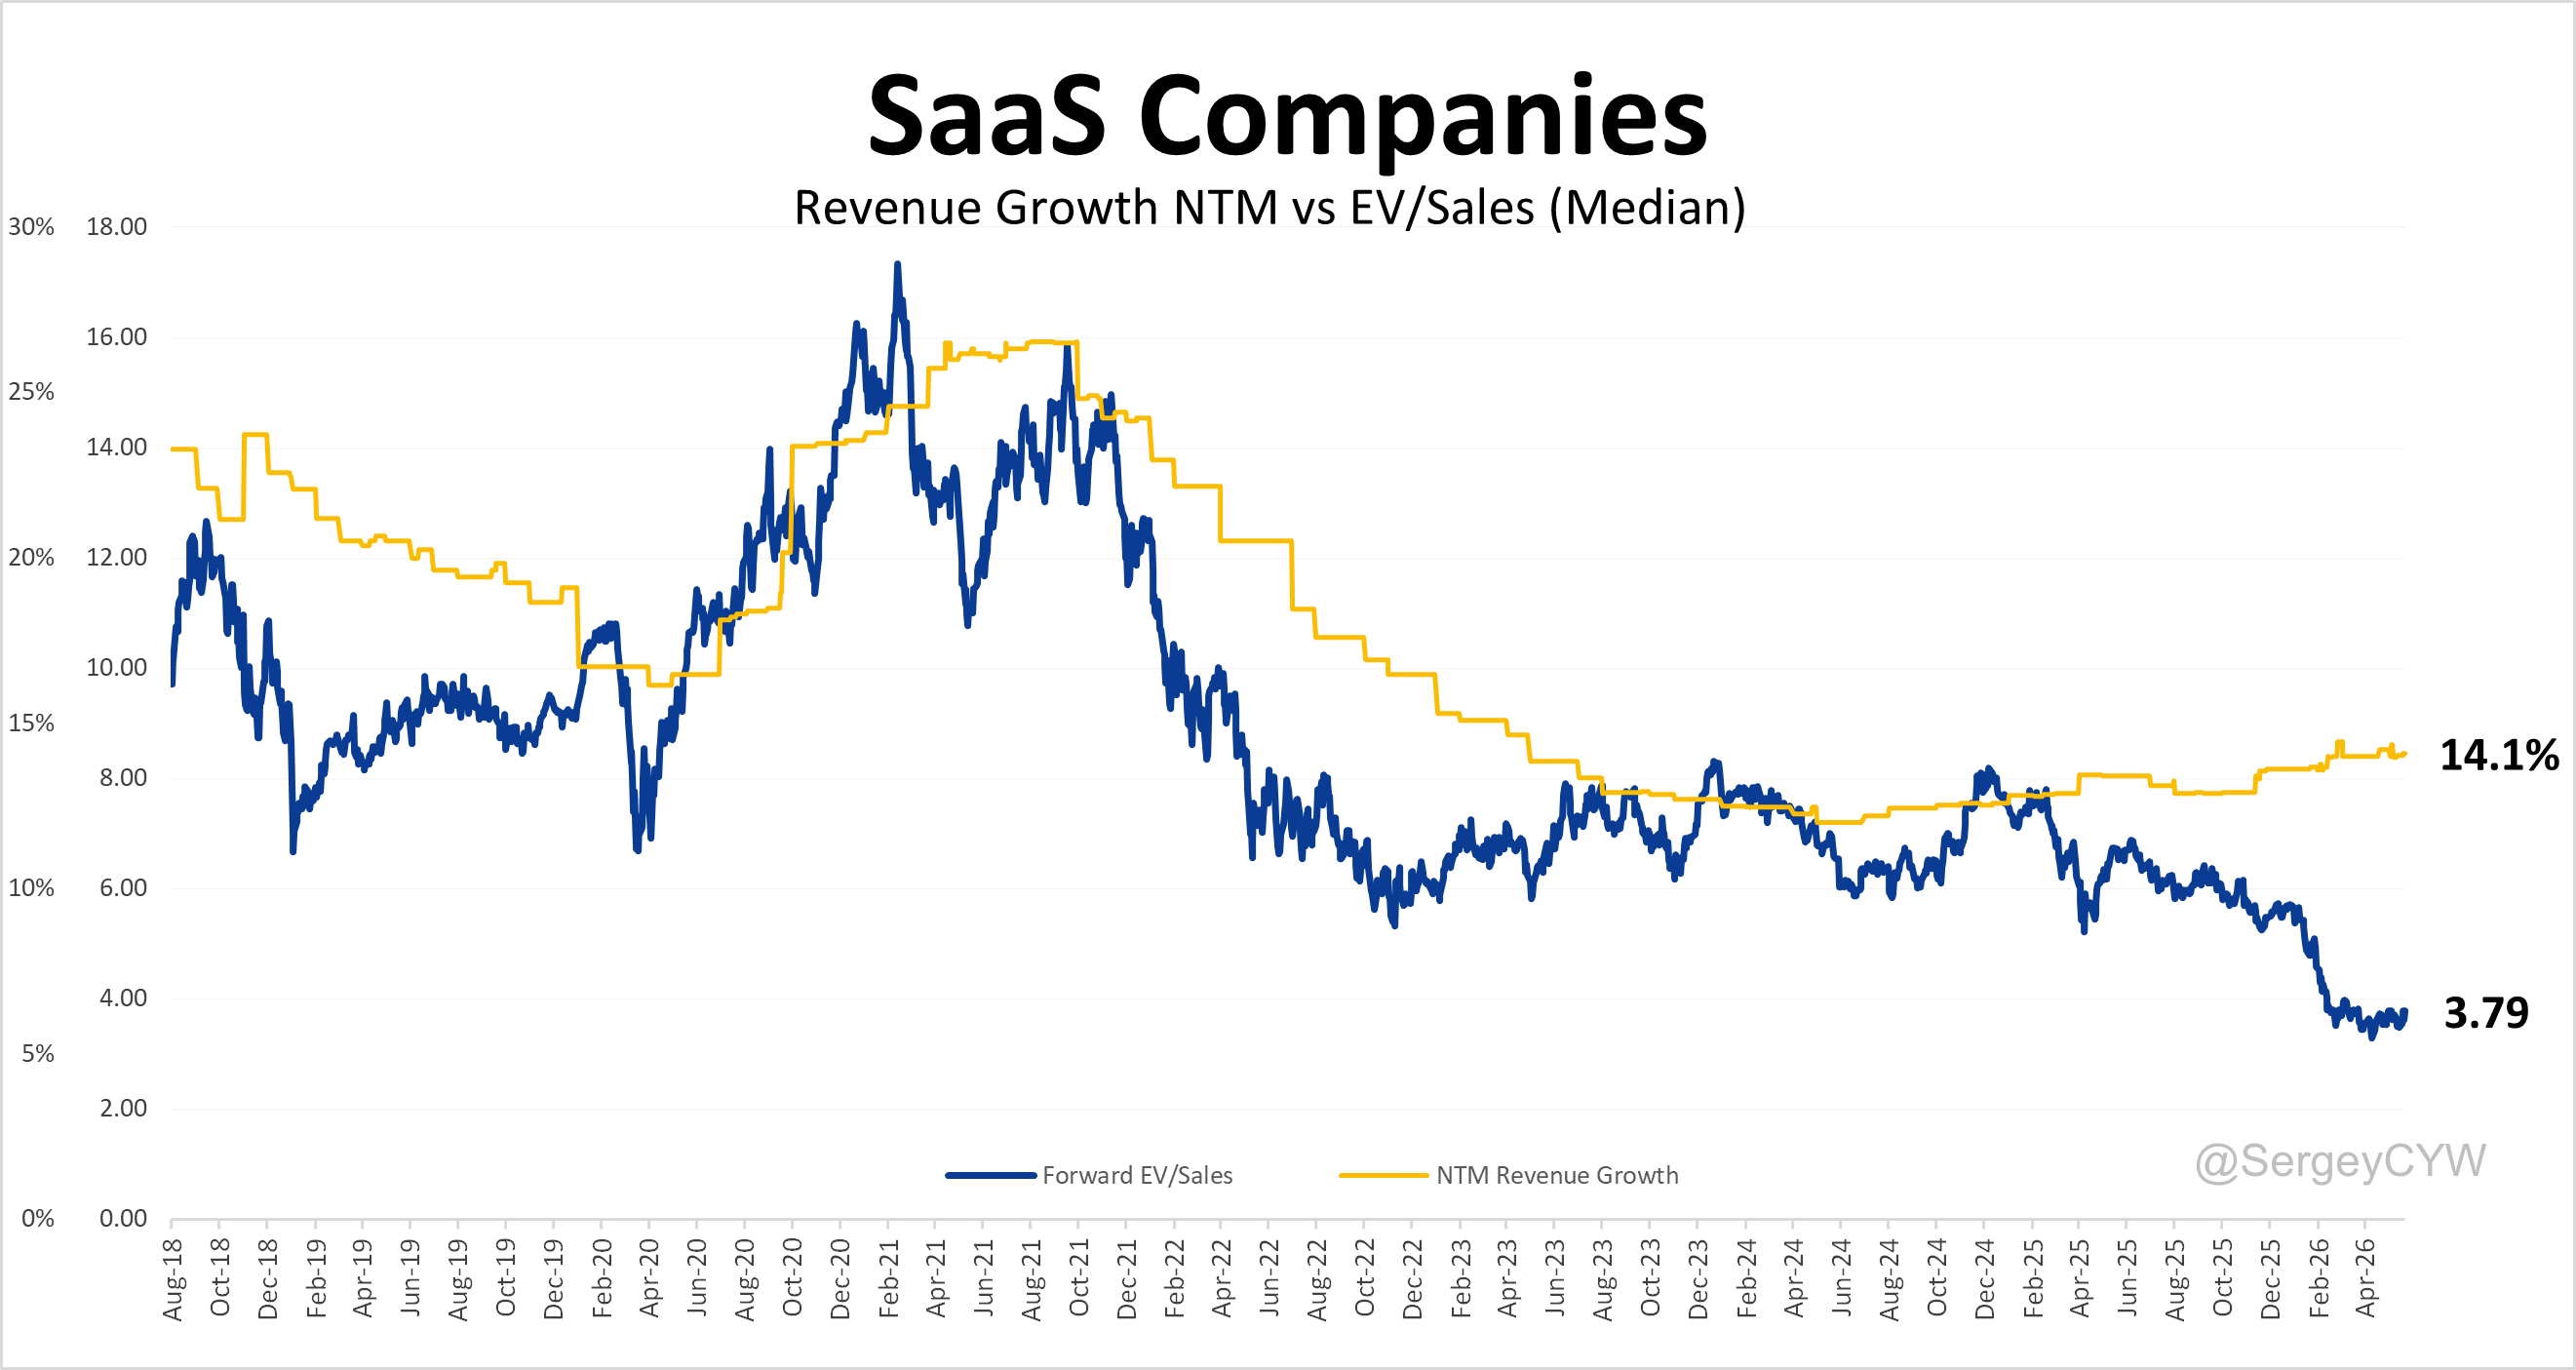
The dataset includes 86 public subscription-based software companies, along with historical data from several businesses that are no longer publicly traded.
For the top 10 fastest-growing SaaS companies, the median EV/Sales multiple is 11.00, paired with 29.1% NTM revenue growth.
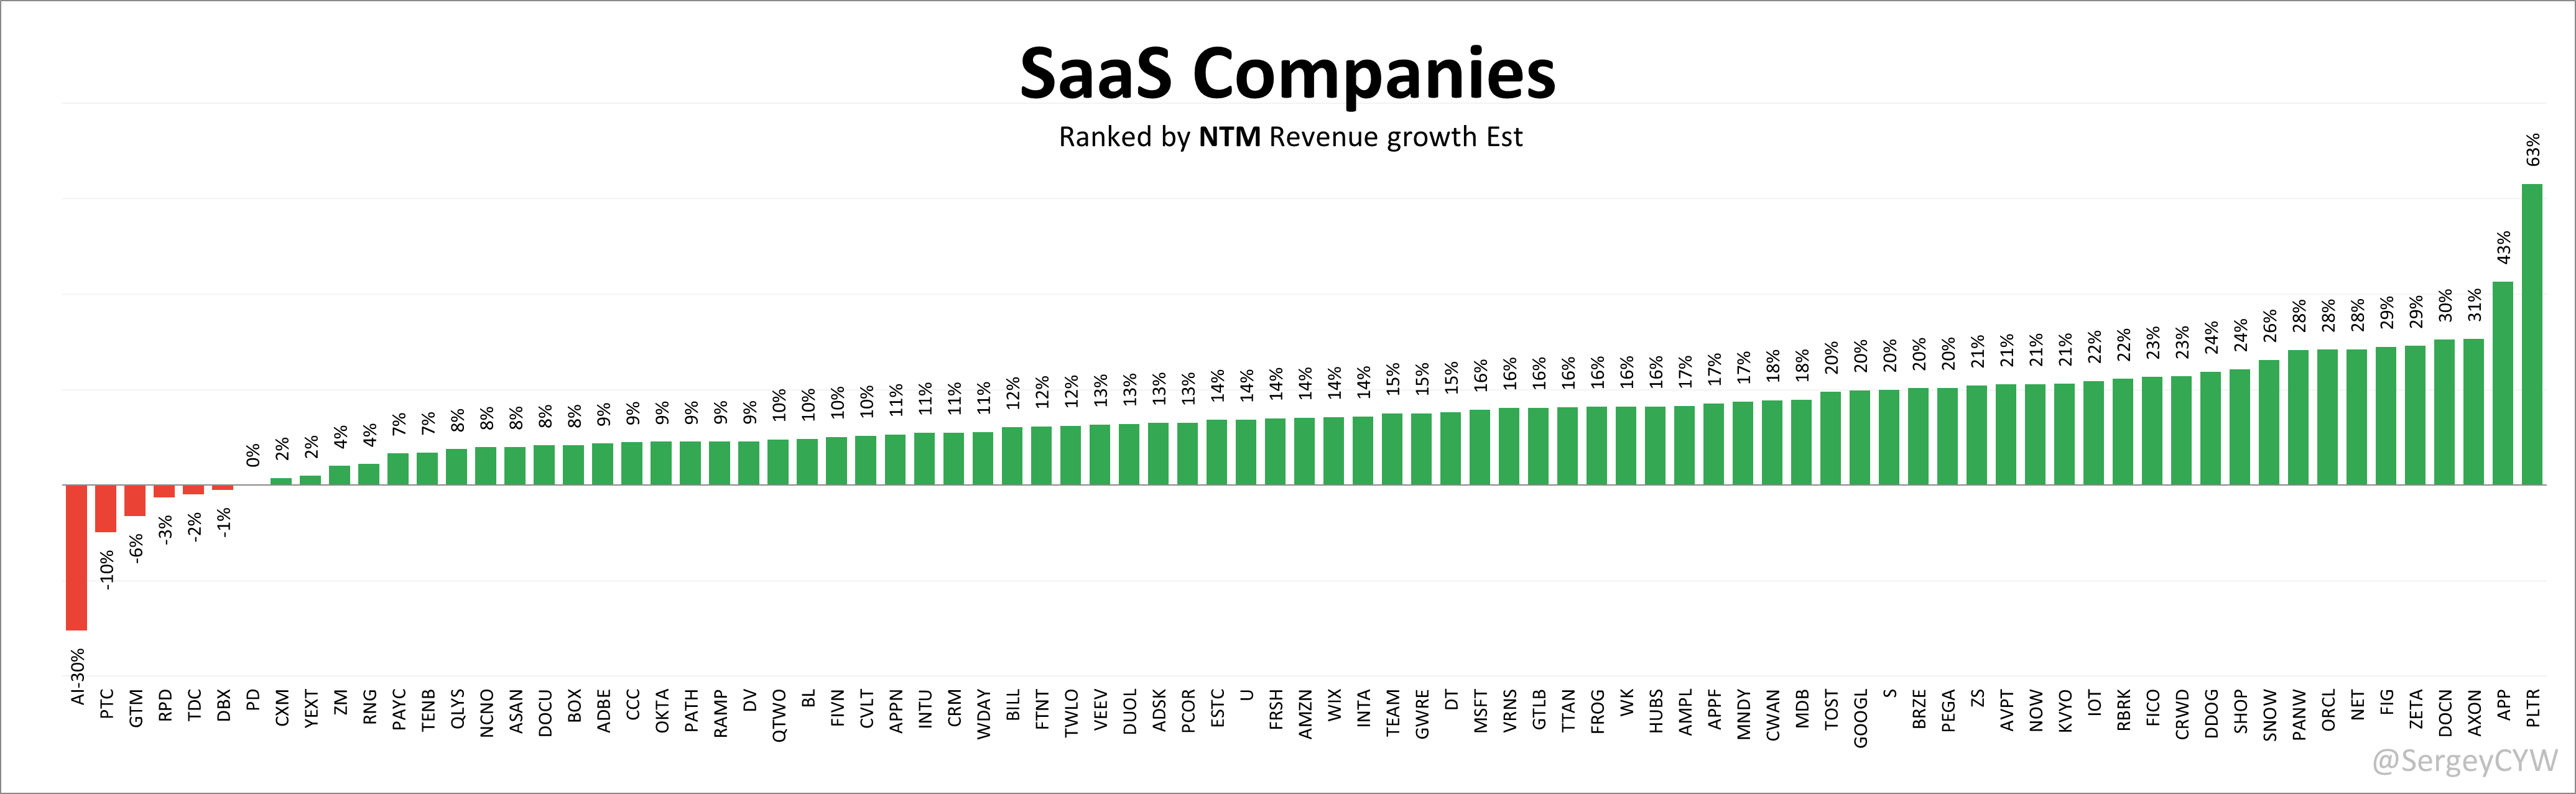
Evaluating growth stocks using forward projected revenue growth is crucial for investors because it provides insight into the company’s future potential, rather than just its current performance.
Forward EV/Gross Profit to NTM Revenue Growth
The EV/Gross Profit (GAAP) multiple relative to projected NTM revenue growth incorporates product efficiency, reflected through gross margin. Gross margin is a critical measure for software companies — consistently high or improving margins usually indicate strong competitive positioning and long-term potential.
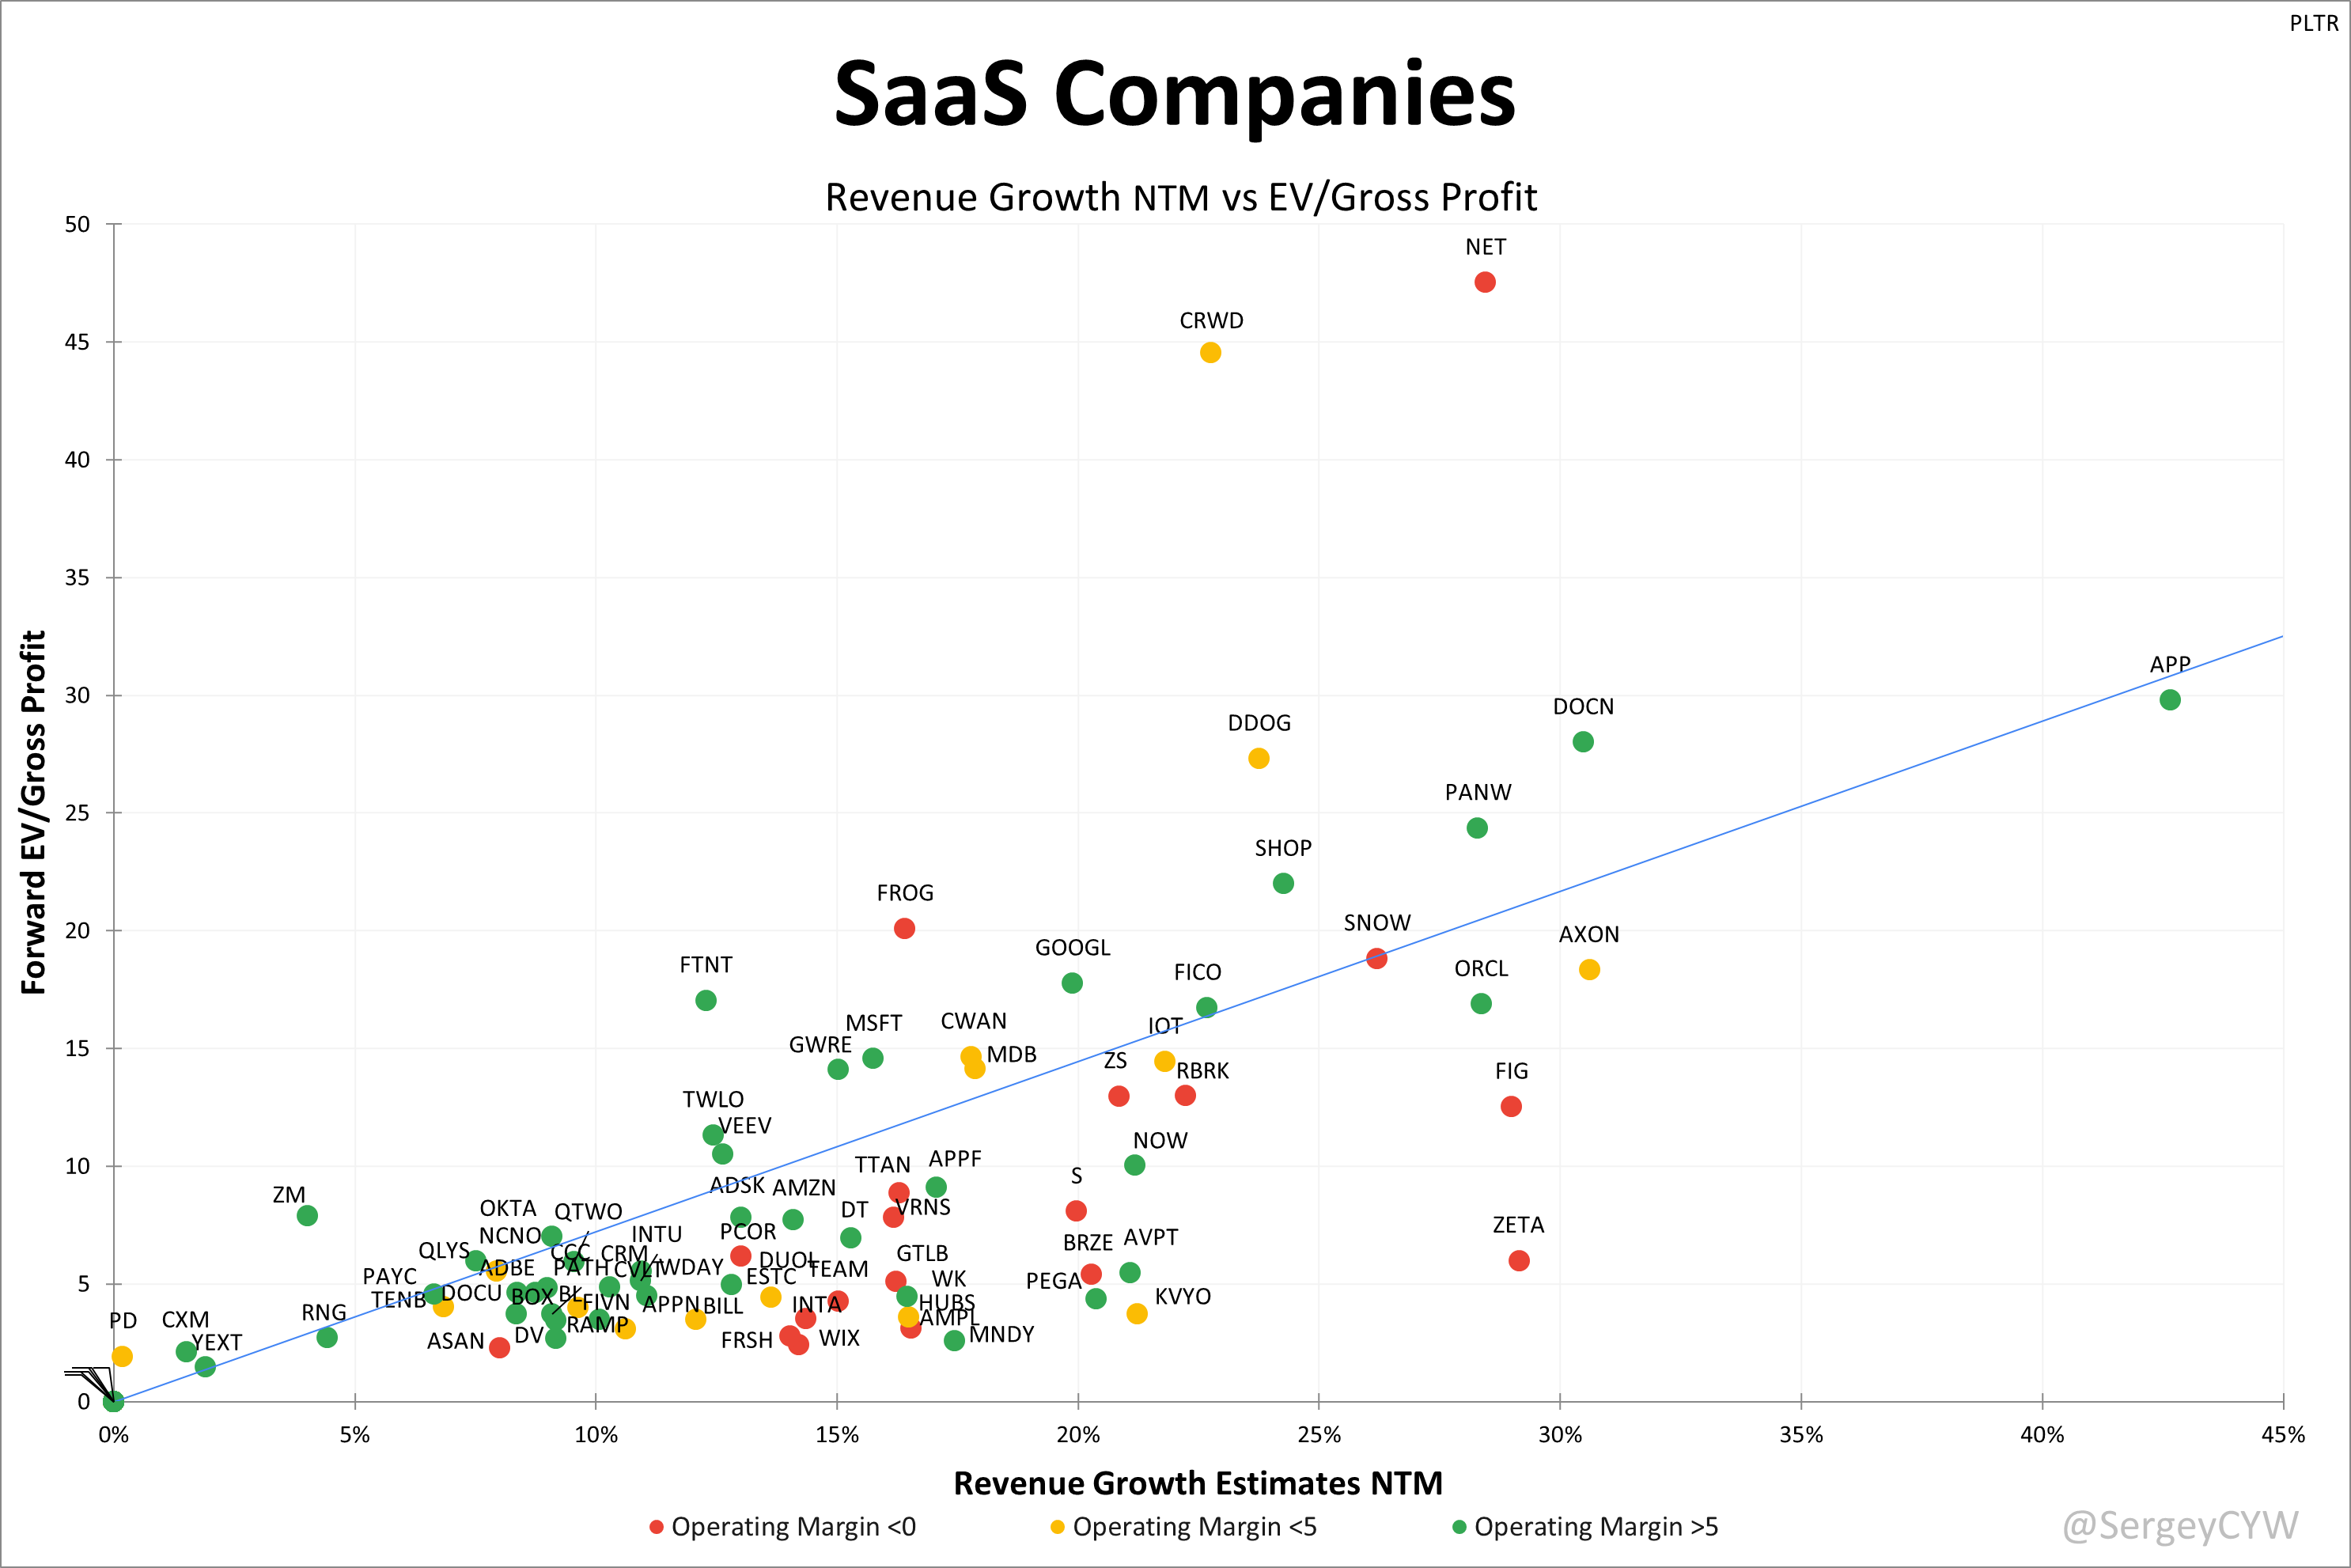
Note: $PLTR was removed from this chart as well, given its elevated 71.8 Forward EV/Gross Profit multiple. Only companies with EV > $1B and gross margins above 70% are included.
PSG (Price/Sales/Growth)
The Price/Sales/Growth (PSG) ratio adds growth discipline to the traditional P/S ratio, helping investors evaluate whether a premium valuation is backed by actual revenue expansion. This is especially relevant in software, where high P/S ratios often reflect expectations of scalable growth.
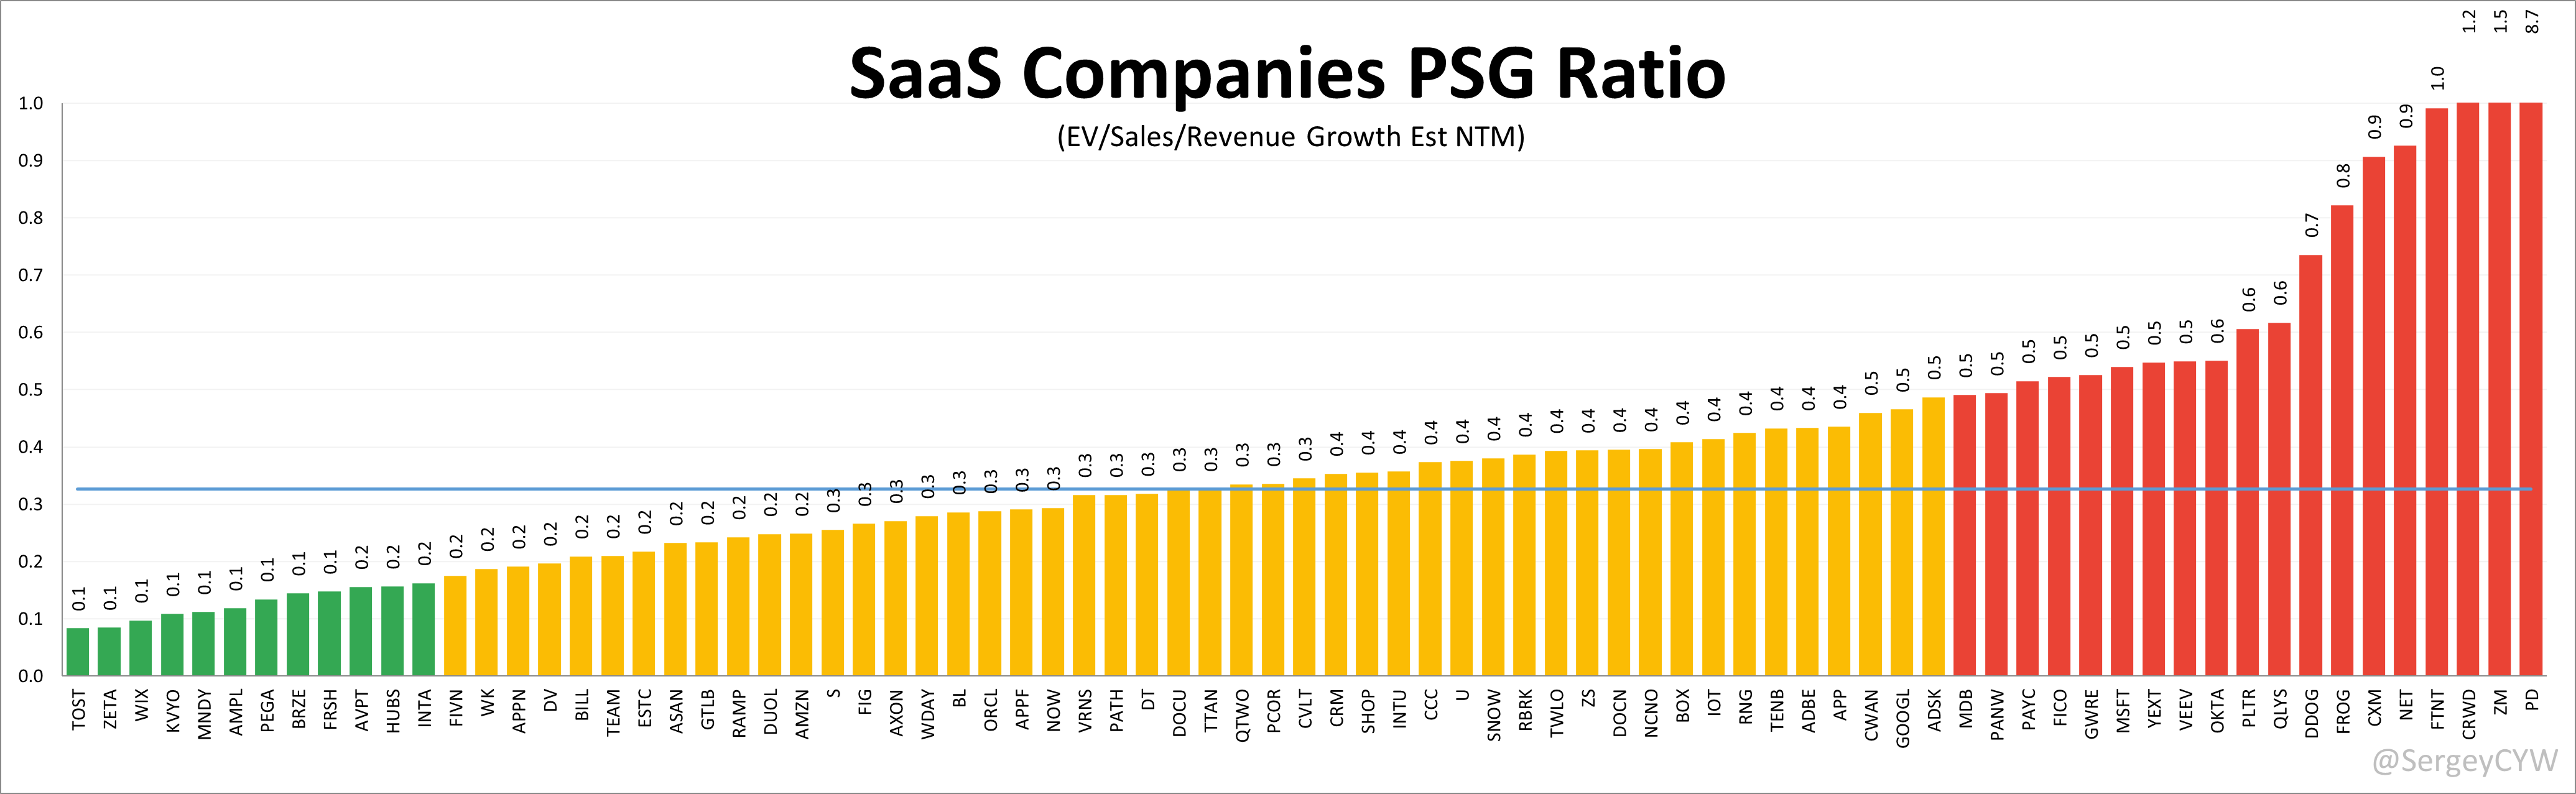
For calculations, I use: EV / NTM Estimated Sales / NTM Revenue Growth
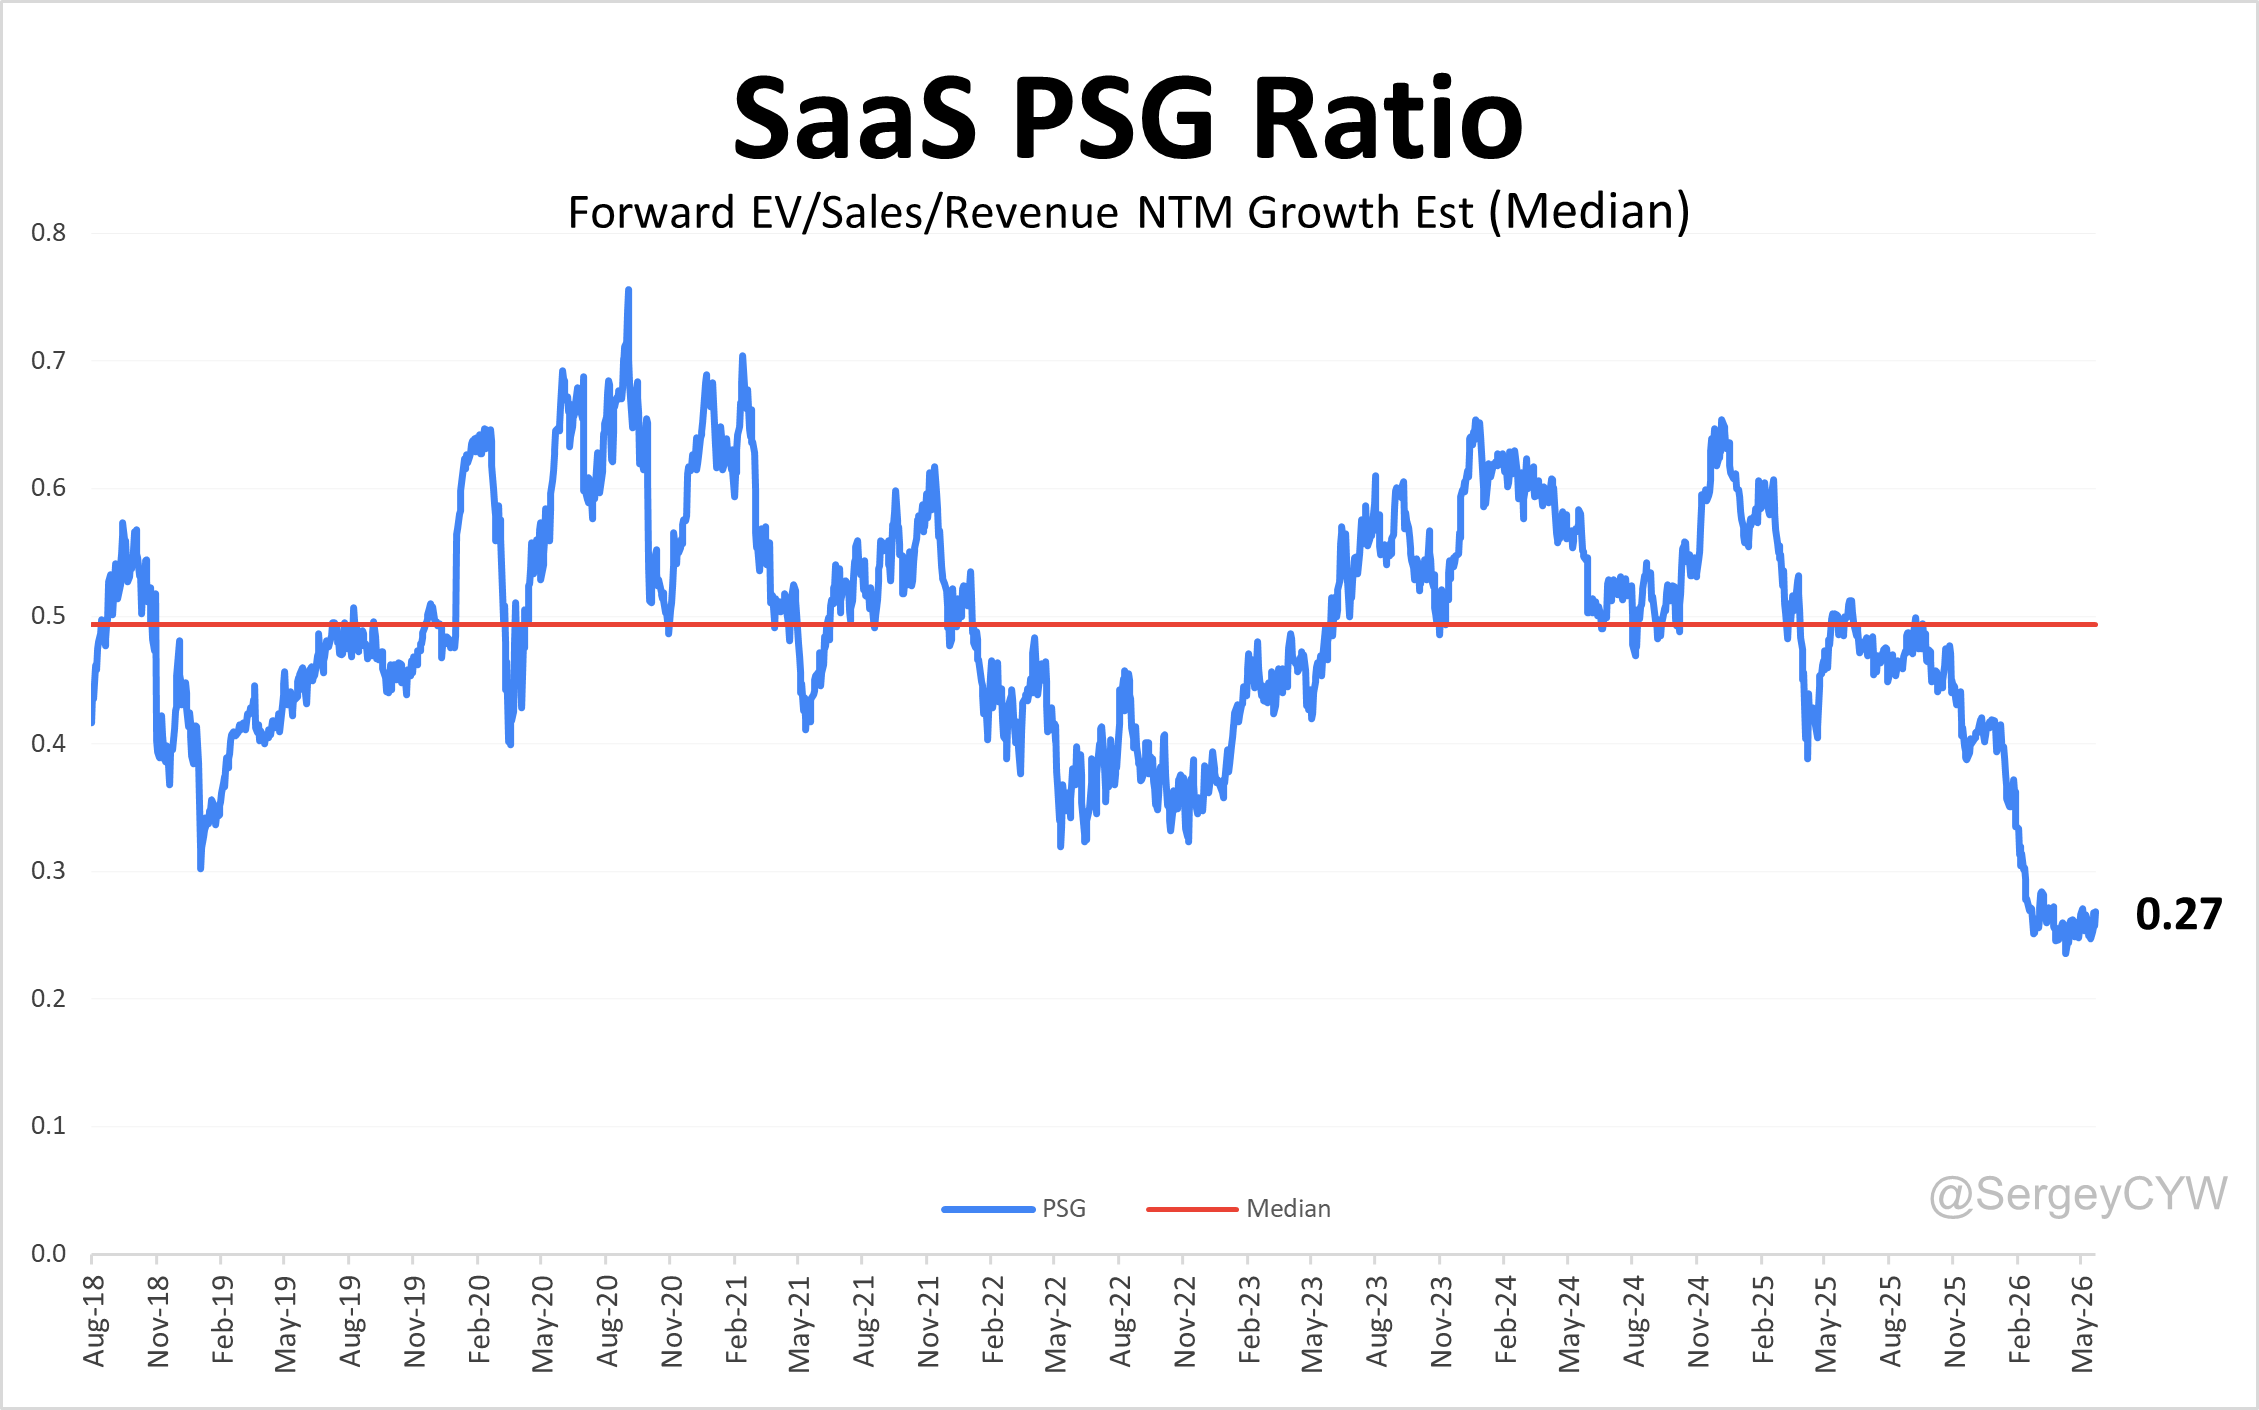
The historical chart for the median PSG multiple among SaaS companies shows a median of 0.27, compared with a long-term historical median of 0.49.
Forward P/E to NTM Revenue Growth
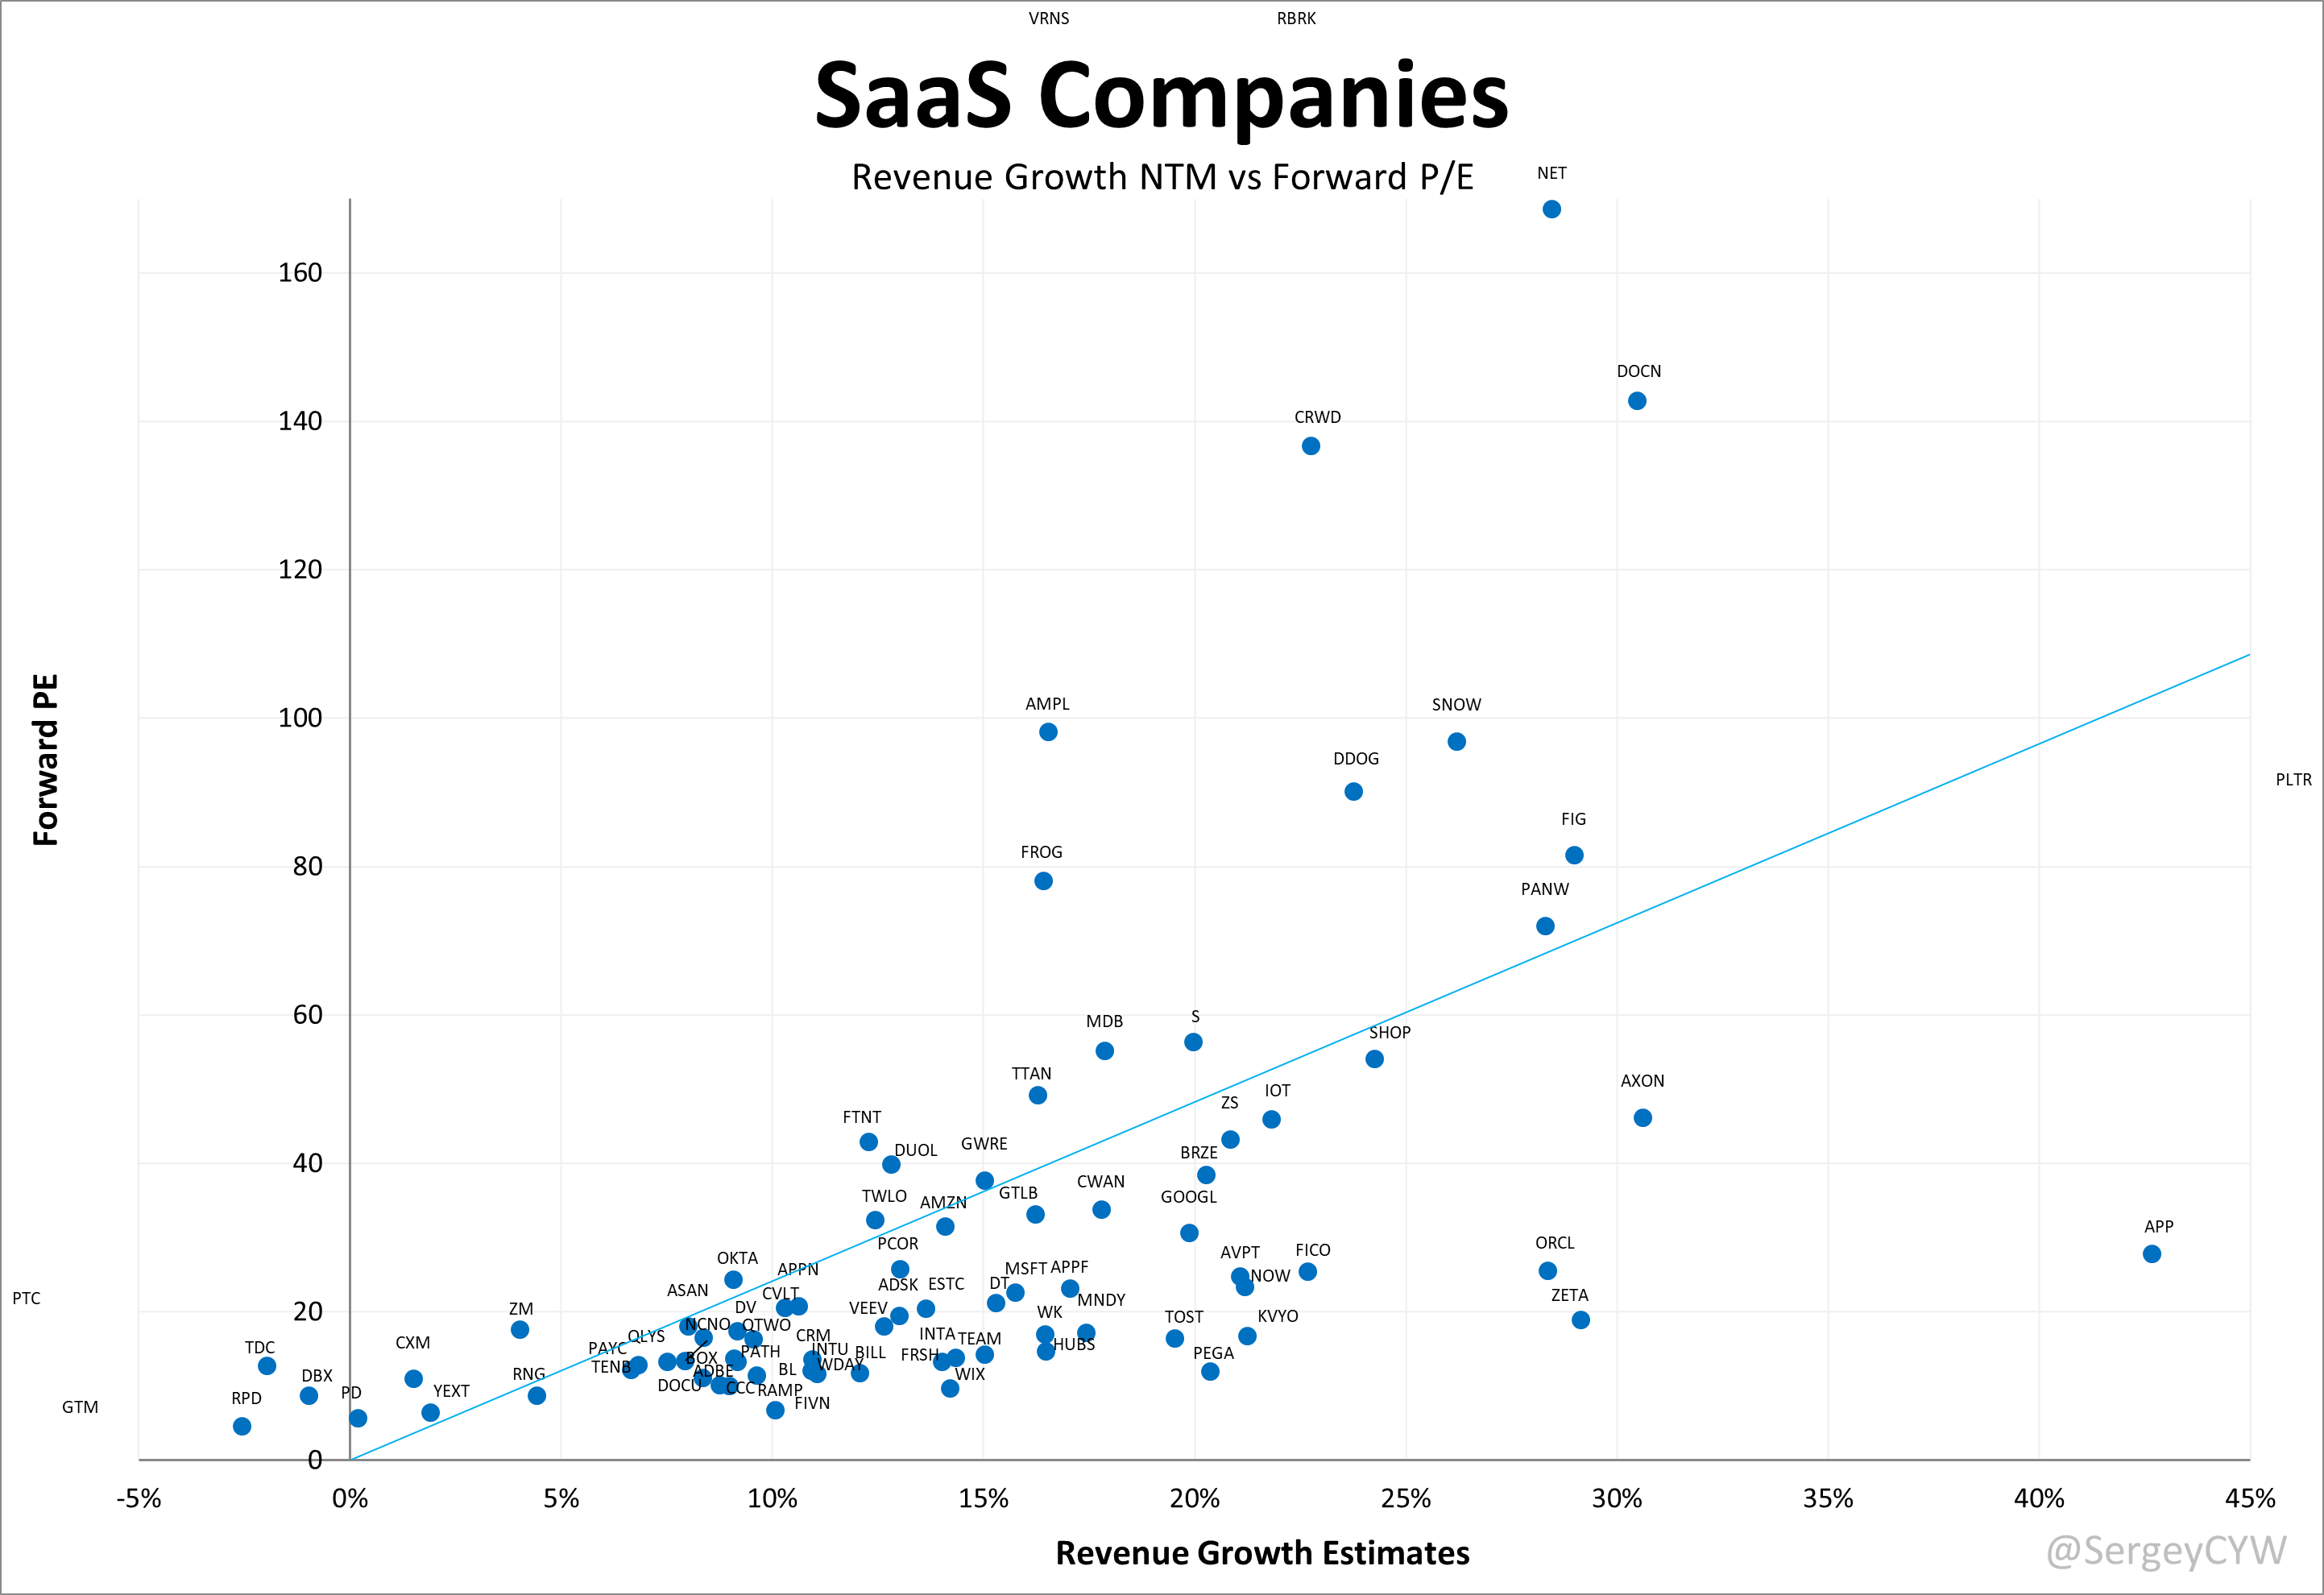
An alternative perspective would be a valuation chart based on the Forward P/E ratio relative to analysts’ revenue growth forecasts.
Rule of 40
The Rule of 40 remains one of the most practical metrics for assessing the balance between growth and profitability in SaaS. A score above 40% generally signals strong operational performance and makes a business more compelling from a capital-efficiency standpoint.
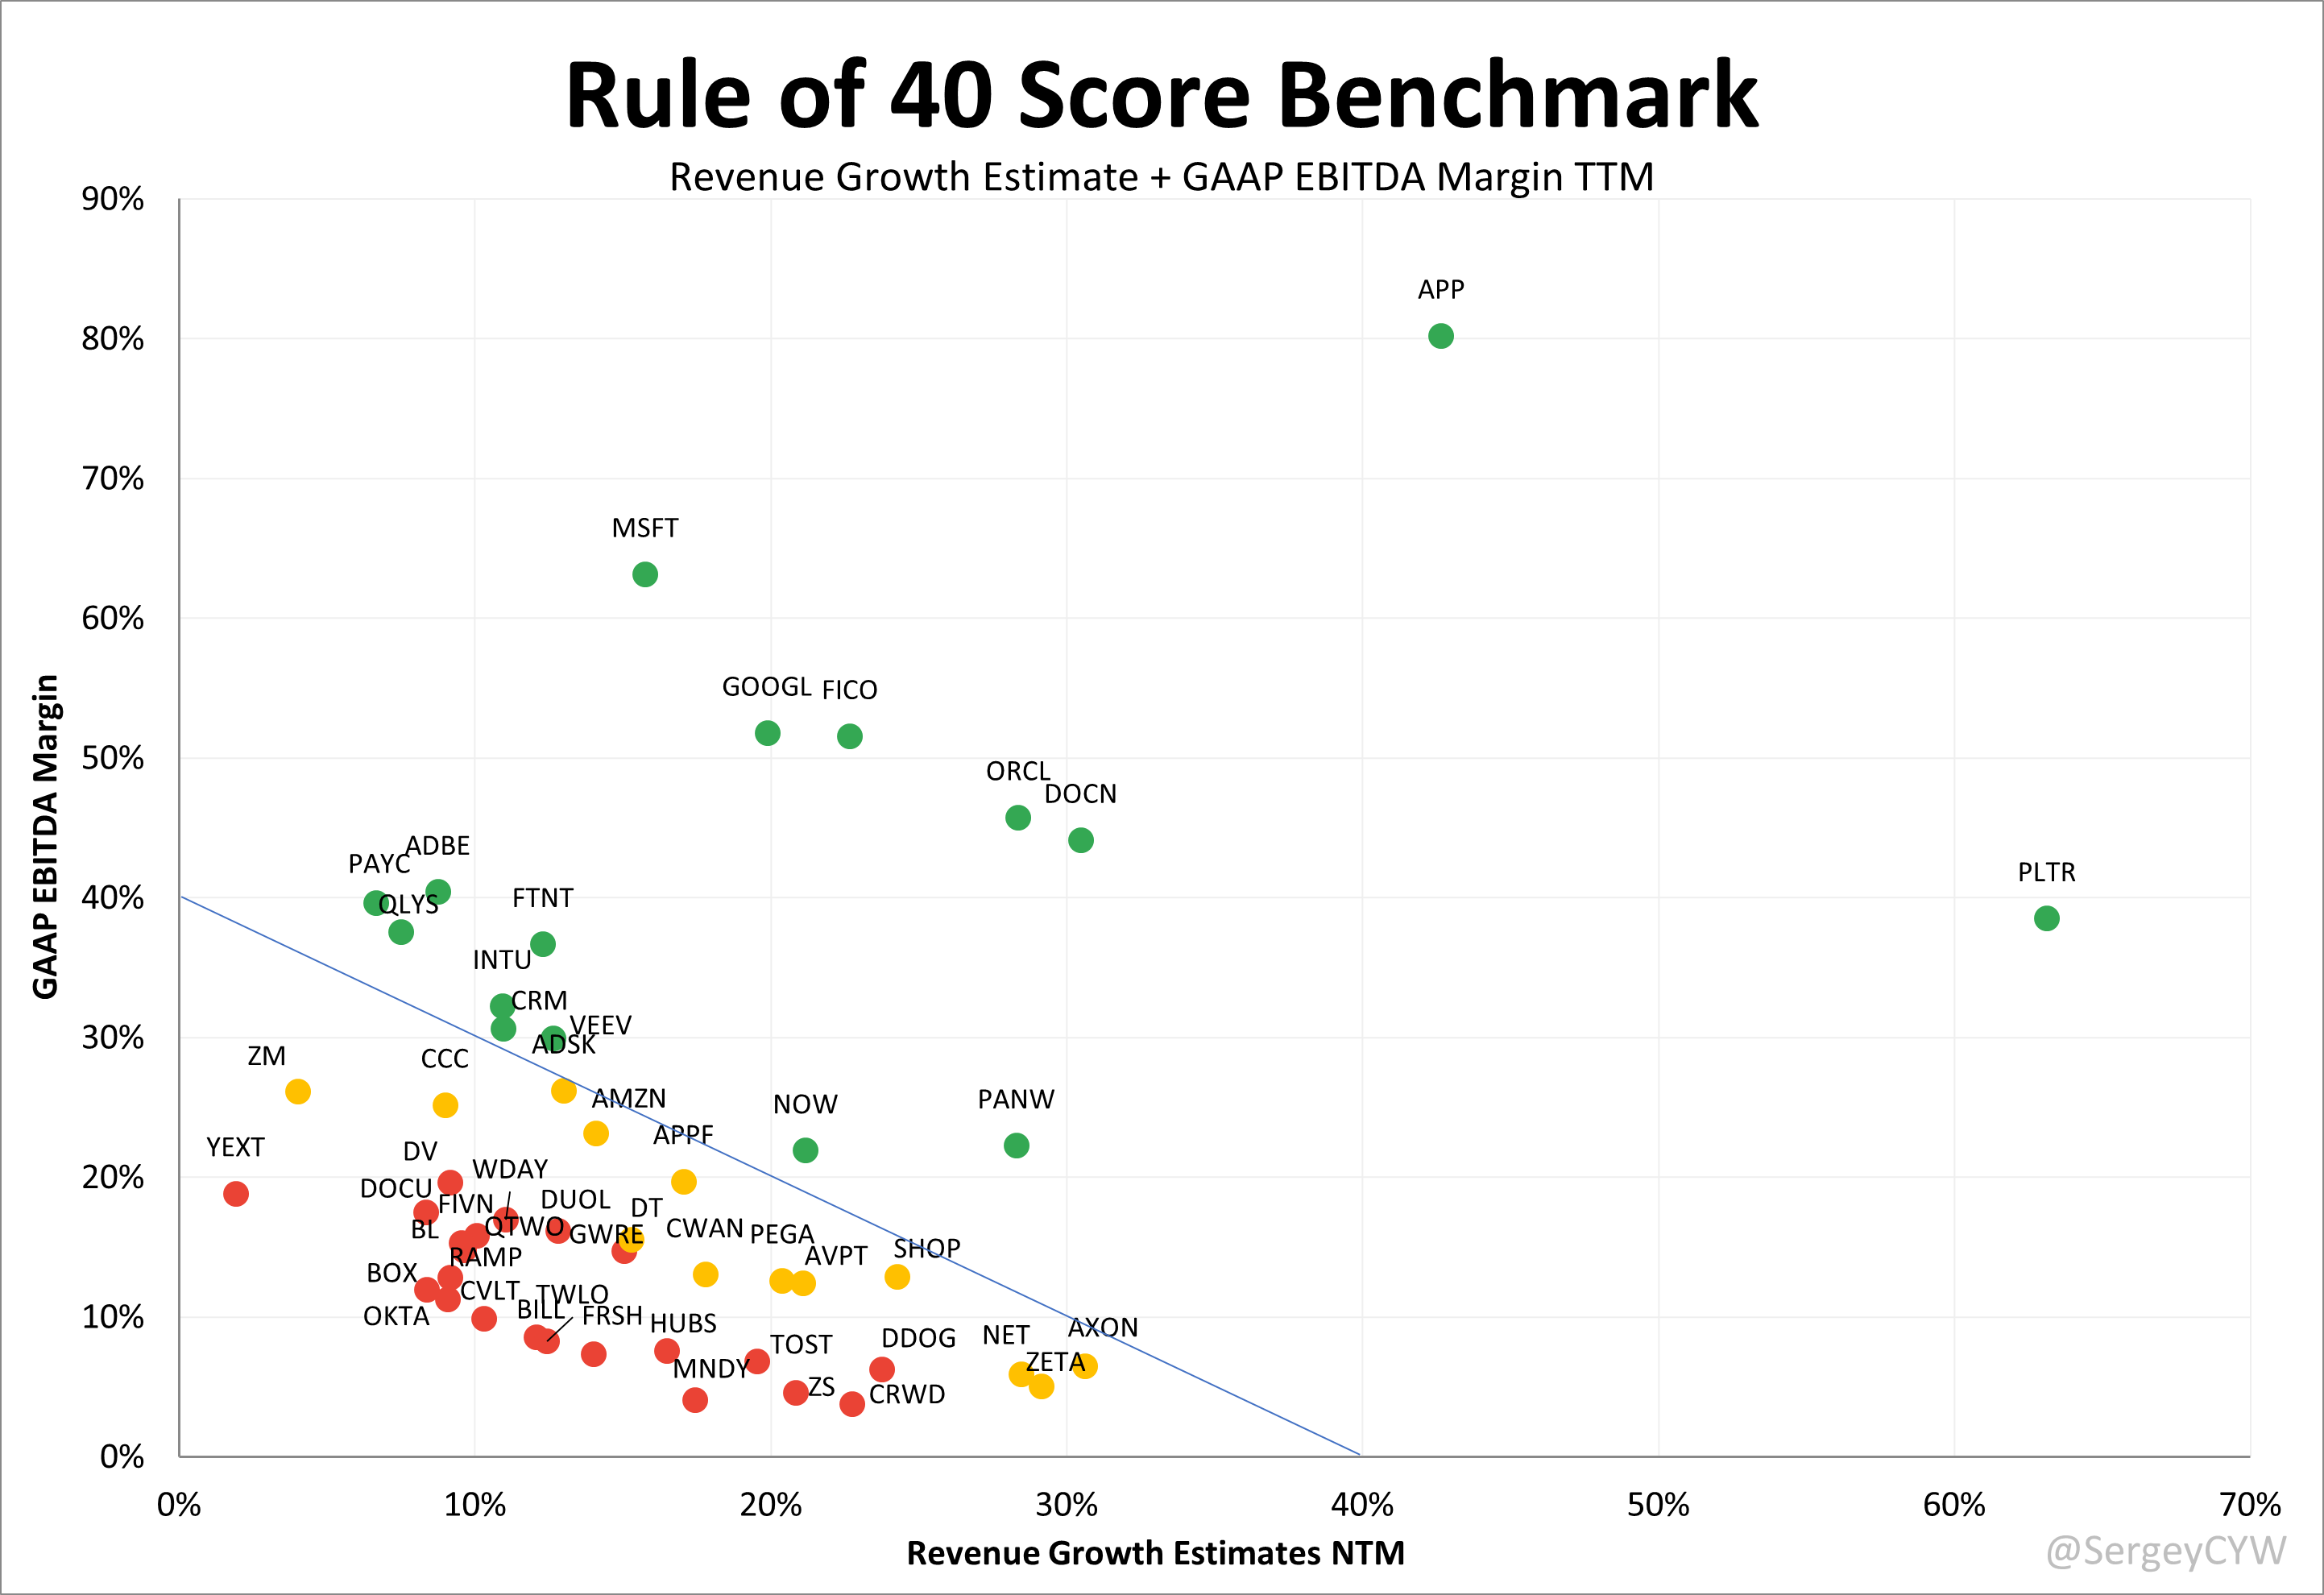
For this chart, I combined GAAP EBITDA Margin (TTM) with revenue growth estimates (NTM), creating a clear view of efficiency relative to future growth.
The Rule of 40 also allows useful comparisons across companies at different maturity levels.
Rule of 40 vs Forward EV/S Multiple
Comparing the Rule of 40 to Forward EV/S multiples highlights how the market prices efficiency versus pure top-line growth.
The Rule of 40 captures operational discipline.
EV/S reflects revenue expectations alone.
Using both provides a more complete framework for evaluating whether investors are paying a reasonable price for sustainable growth.
A company above the 40% threshold tends to attract more interest from investors who prioritize both profitability and forward momentum.
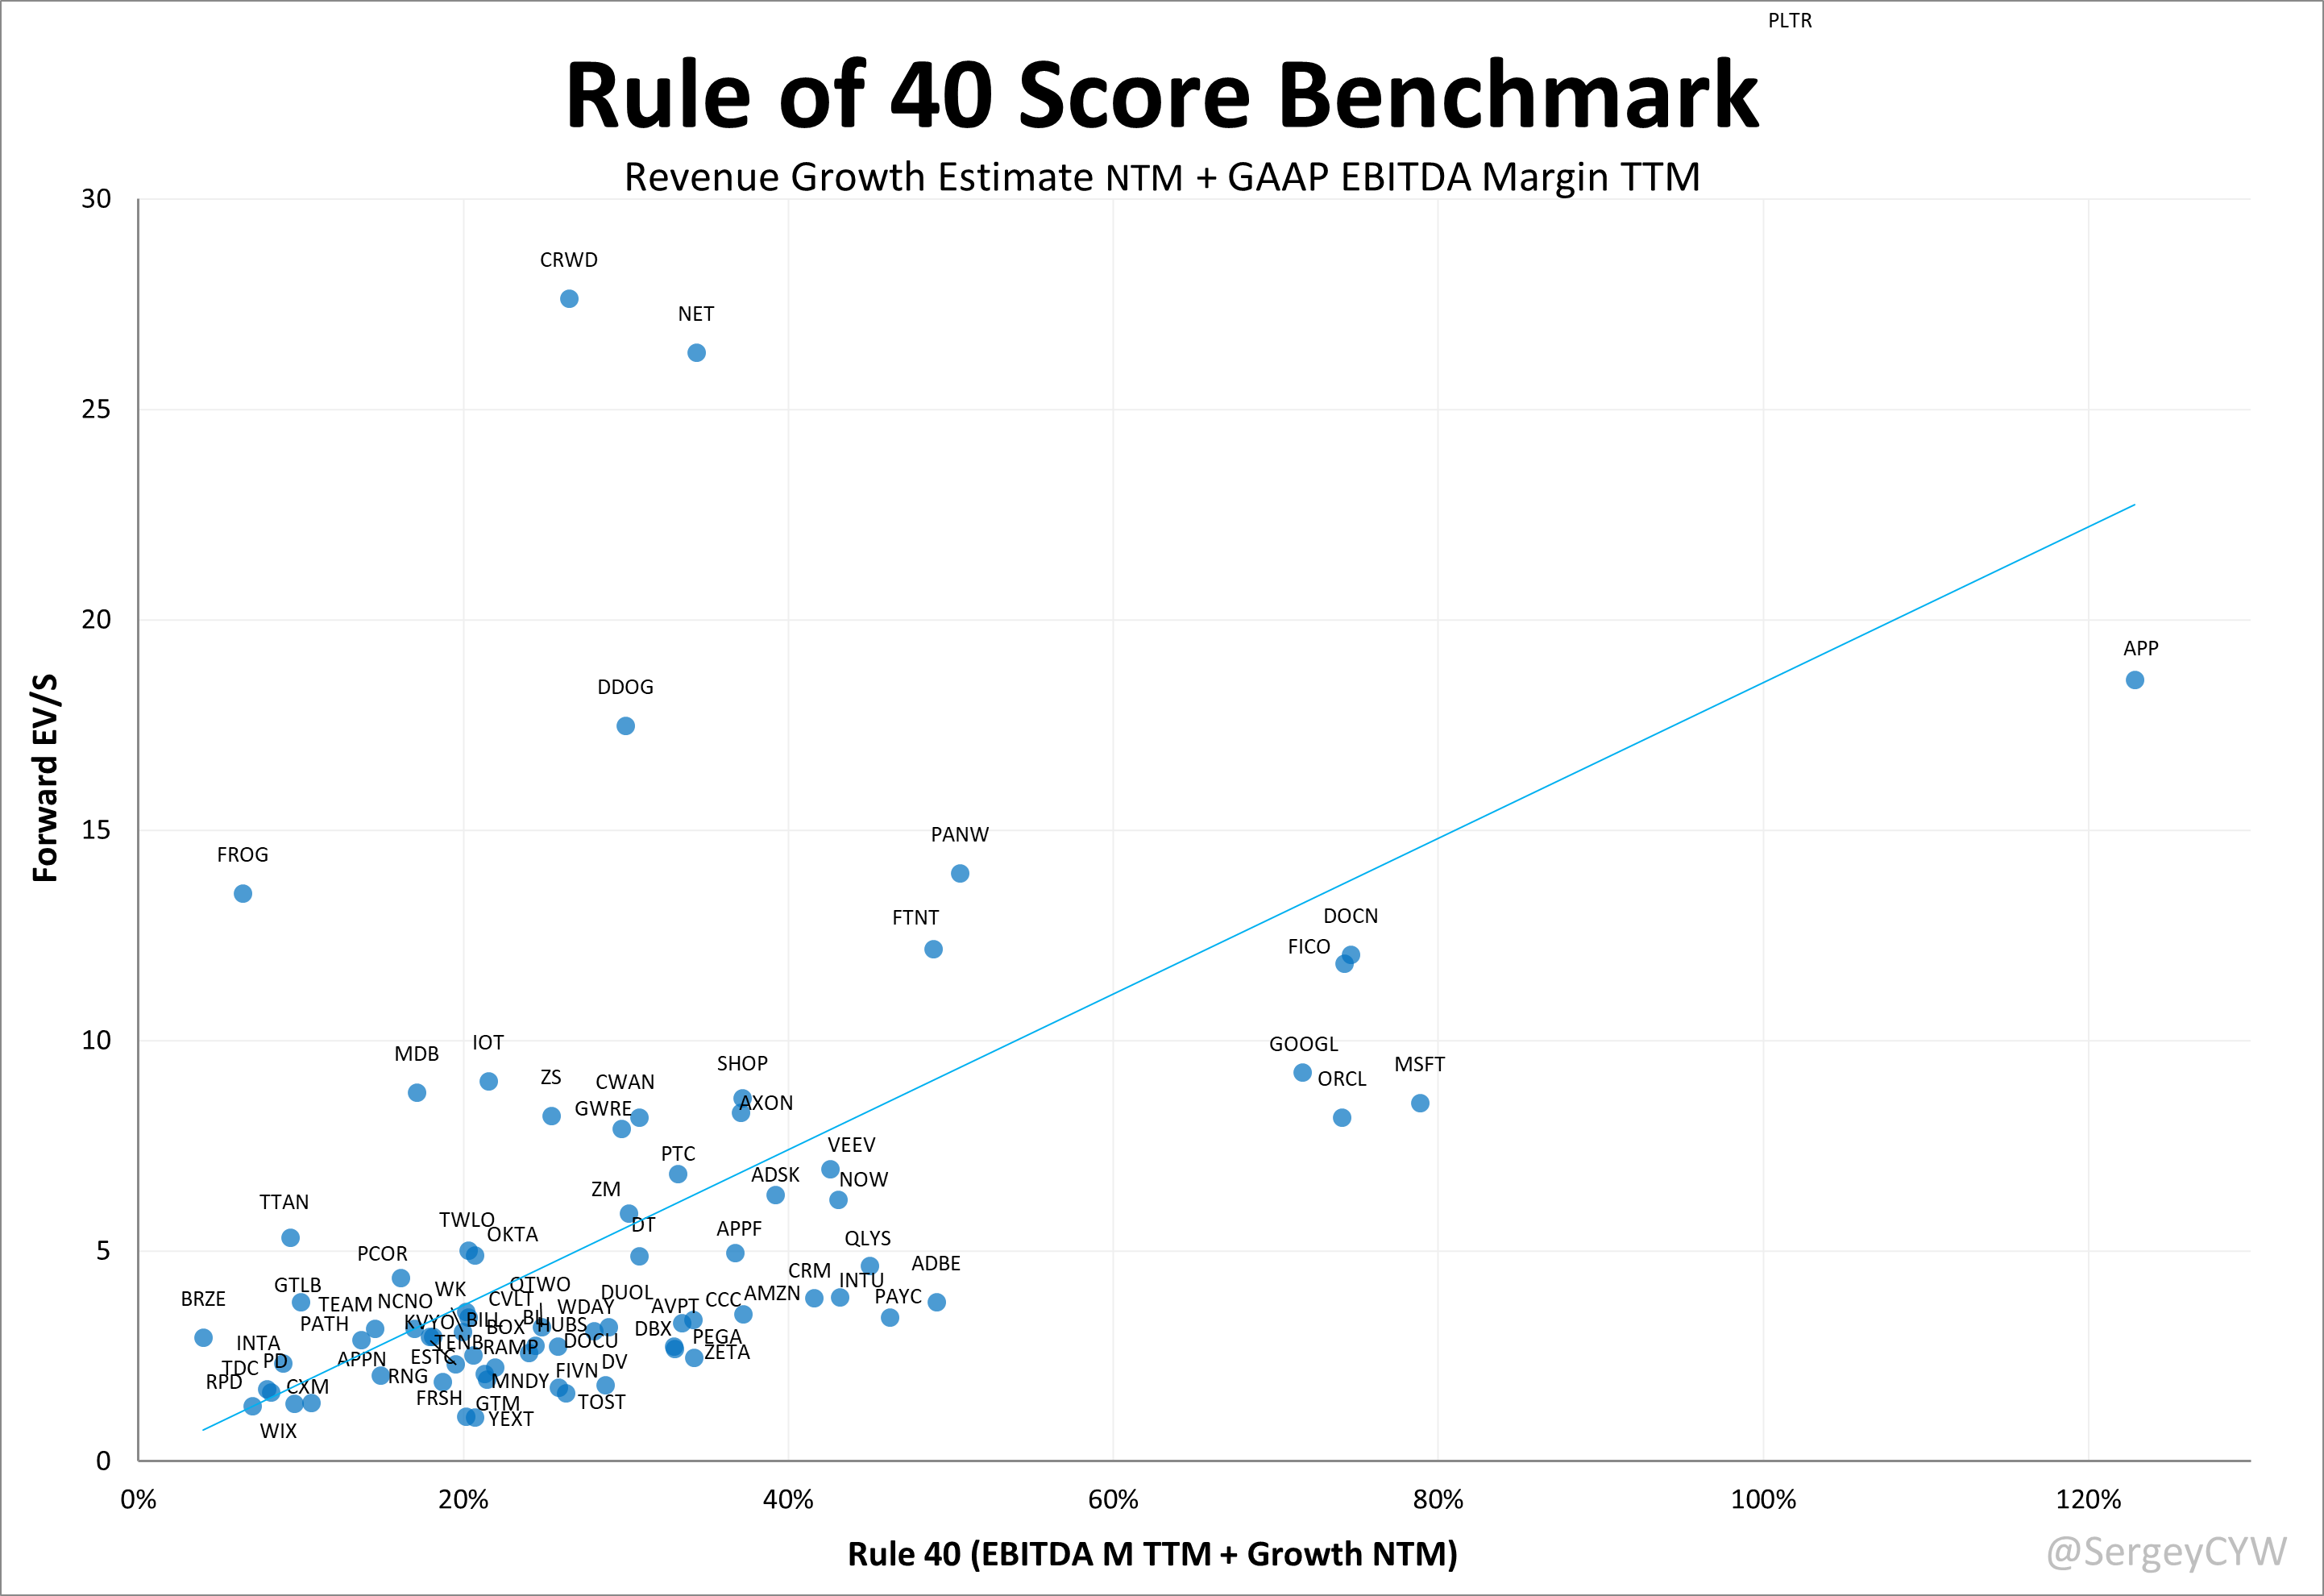
Note: This chart also uses GAAP EBITDA Margin (TTM) and next year’s revenue growth estimates.
Pricing models
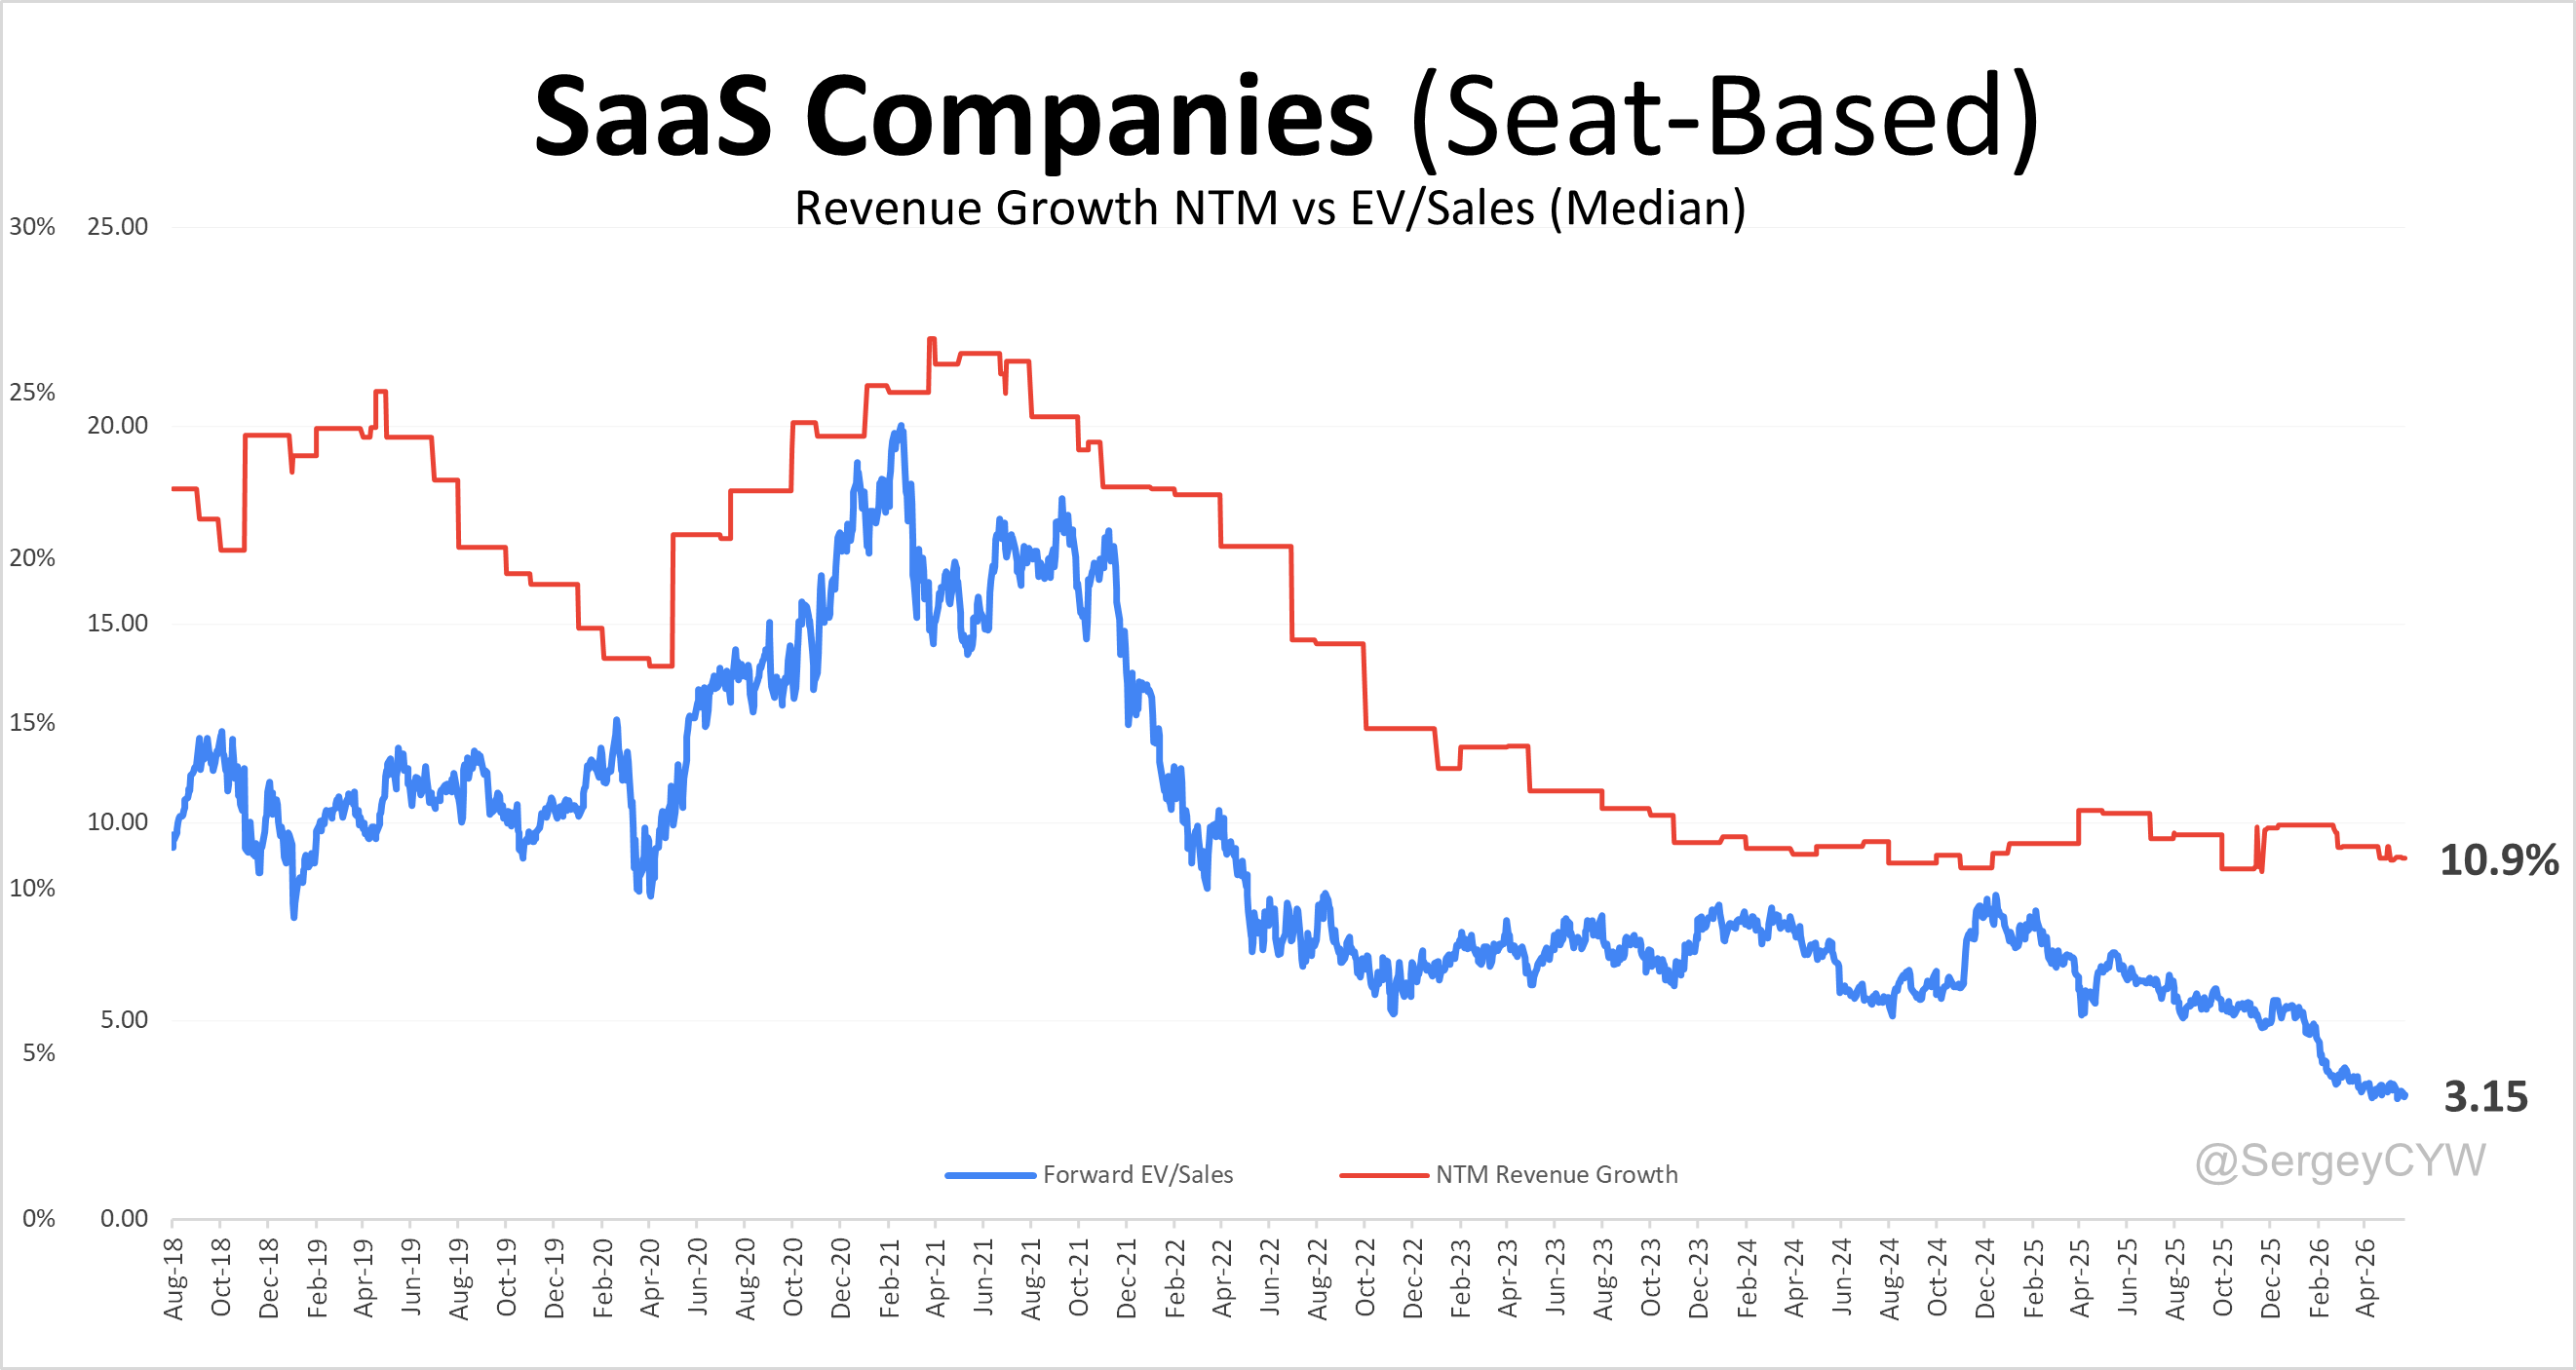
Comparison of median EV/Sales Multiples for subscription-based SaaS companies (including device / fixed-capacity subscriptions and consumption-based models) vs. seat-based subscription SaaS models.
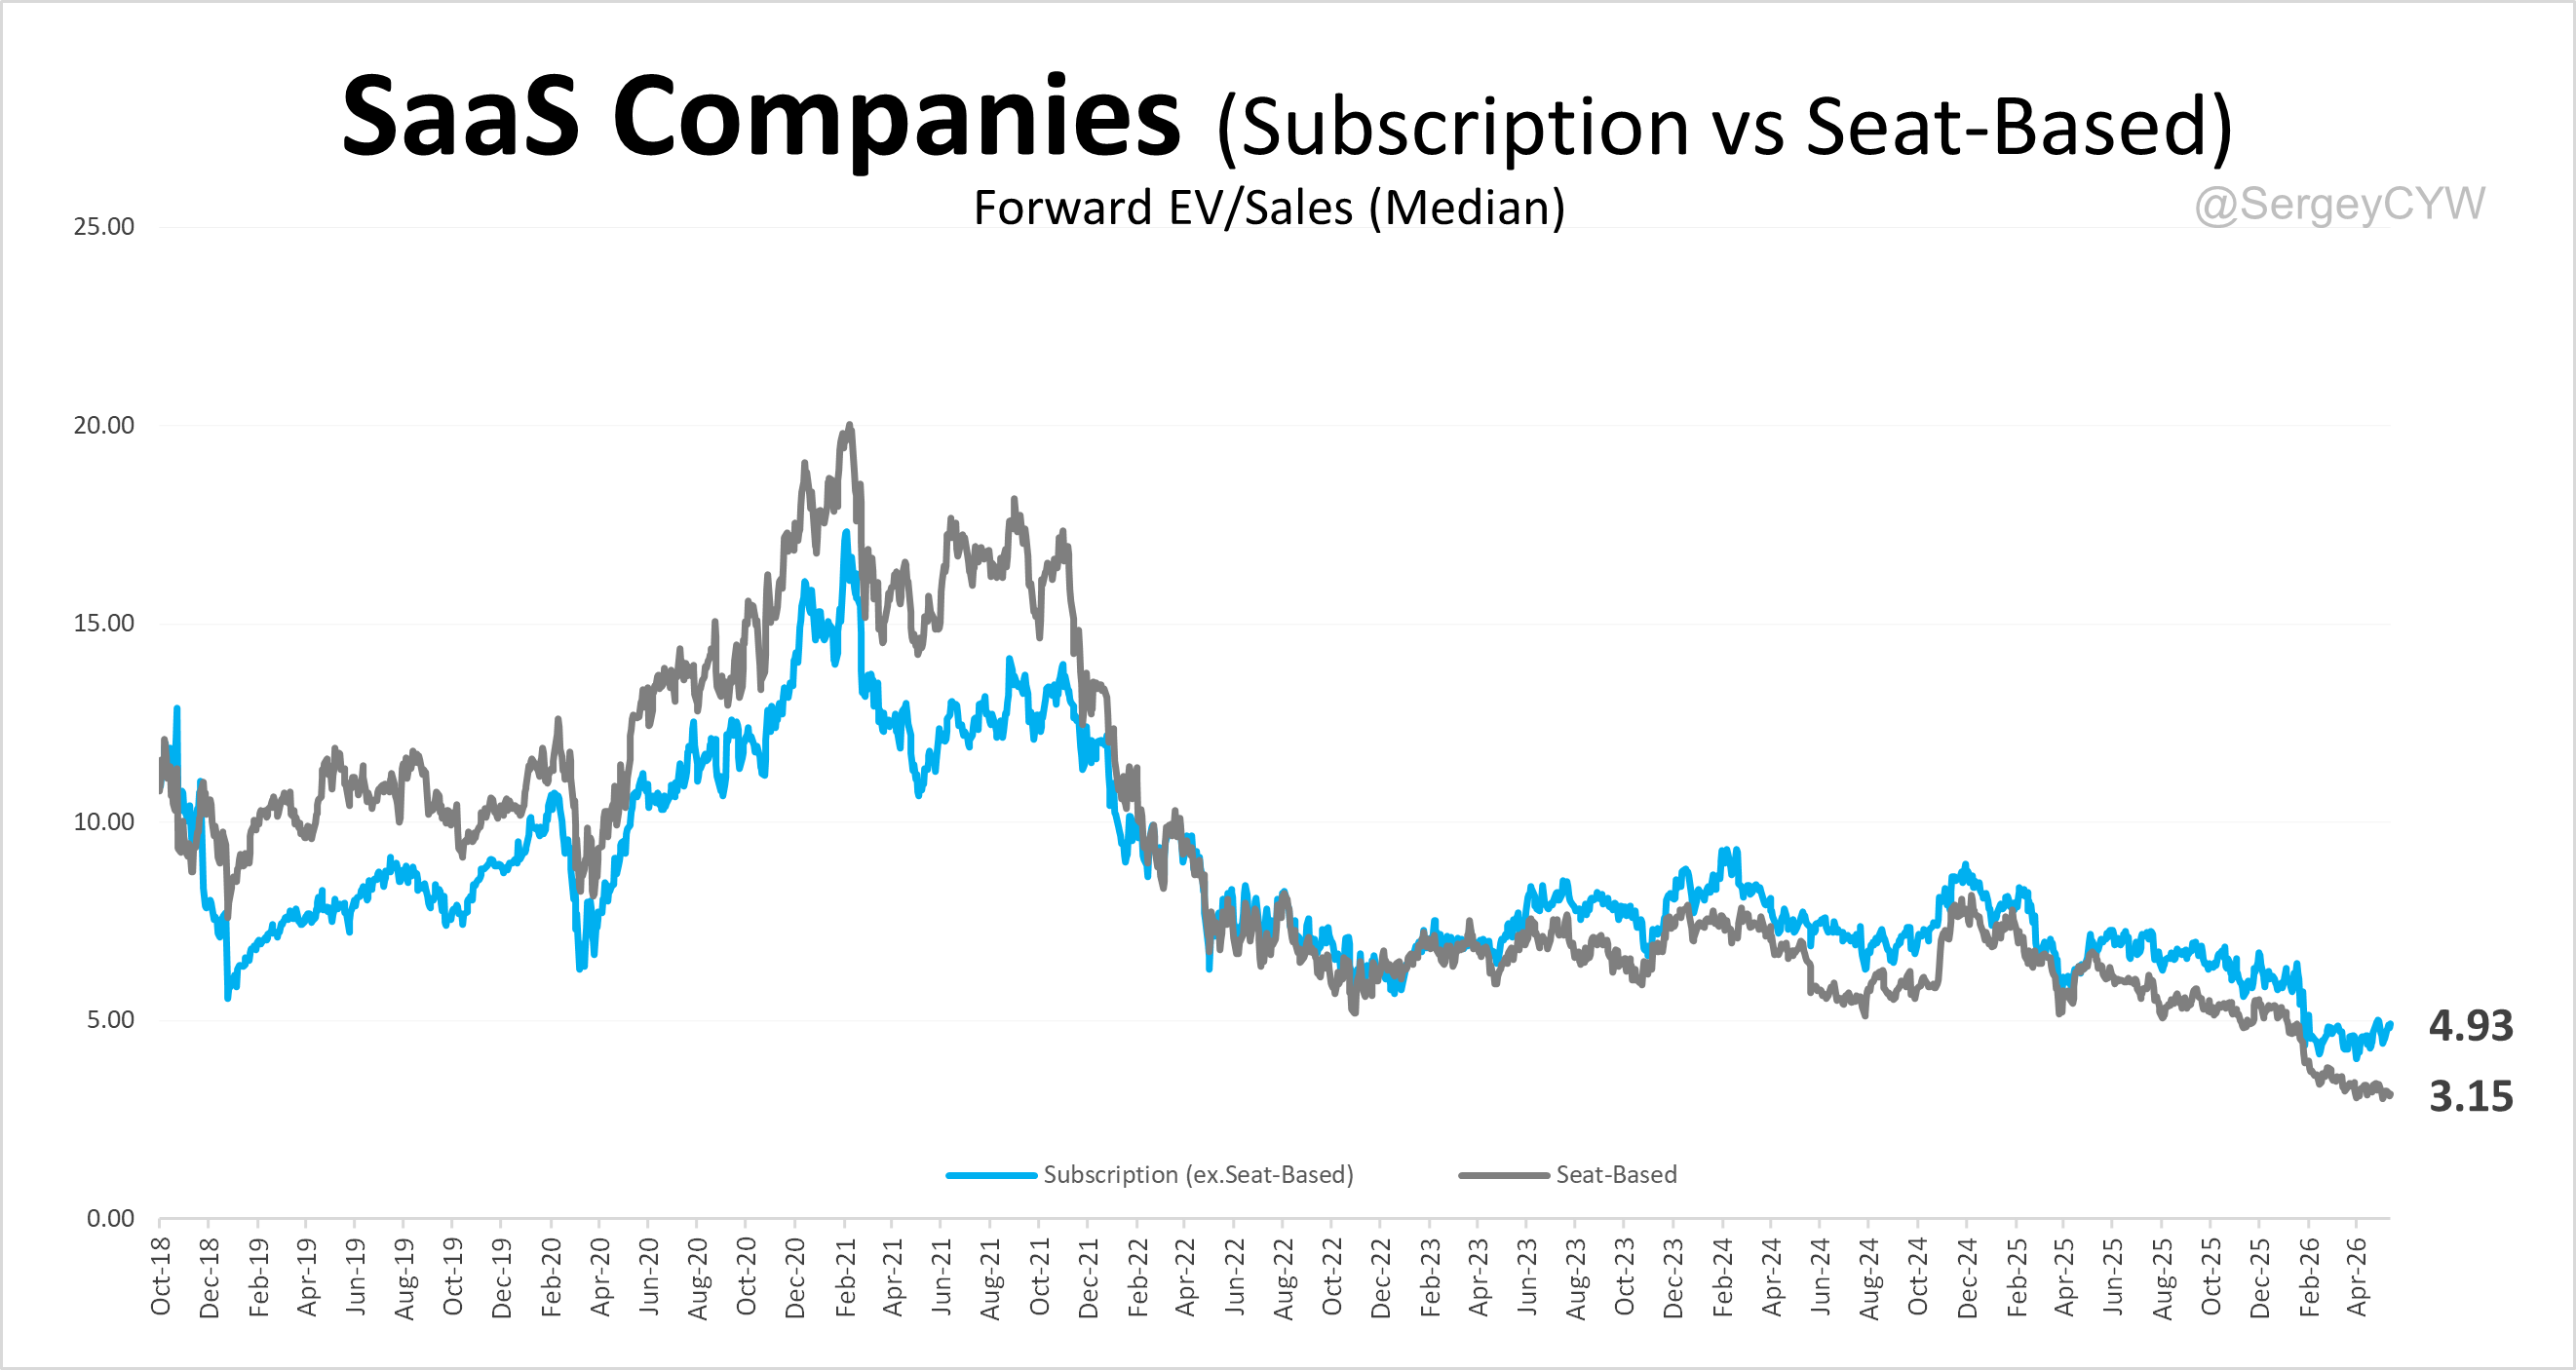
The median EV/Sales multiple for subscription-based SaaS companies (including device / fixed-capacity subscriptions and consumption-based models) is 4.93x, with analyst-estimated NTM revenue growth of 16.3% YoY.
The dataset includes 50 public SaaS companies.
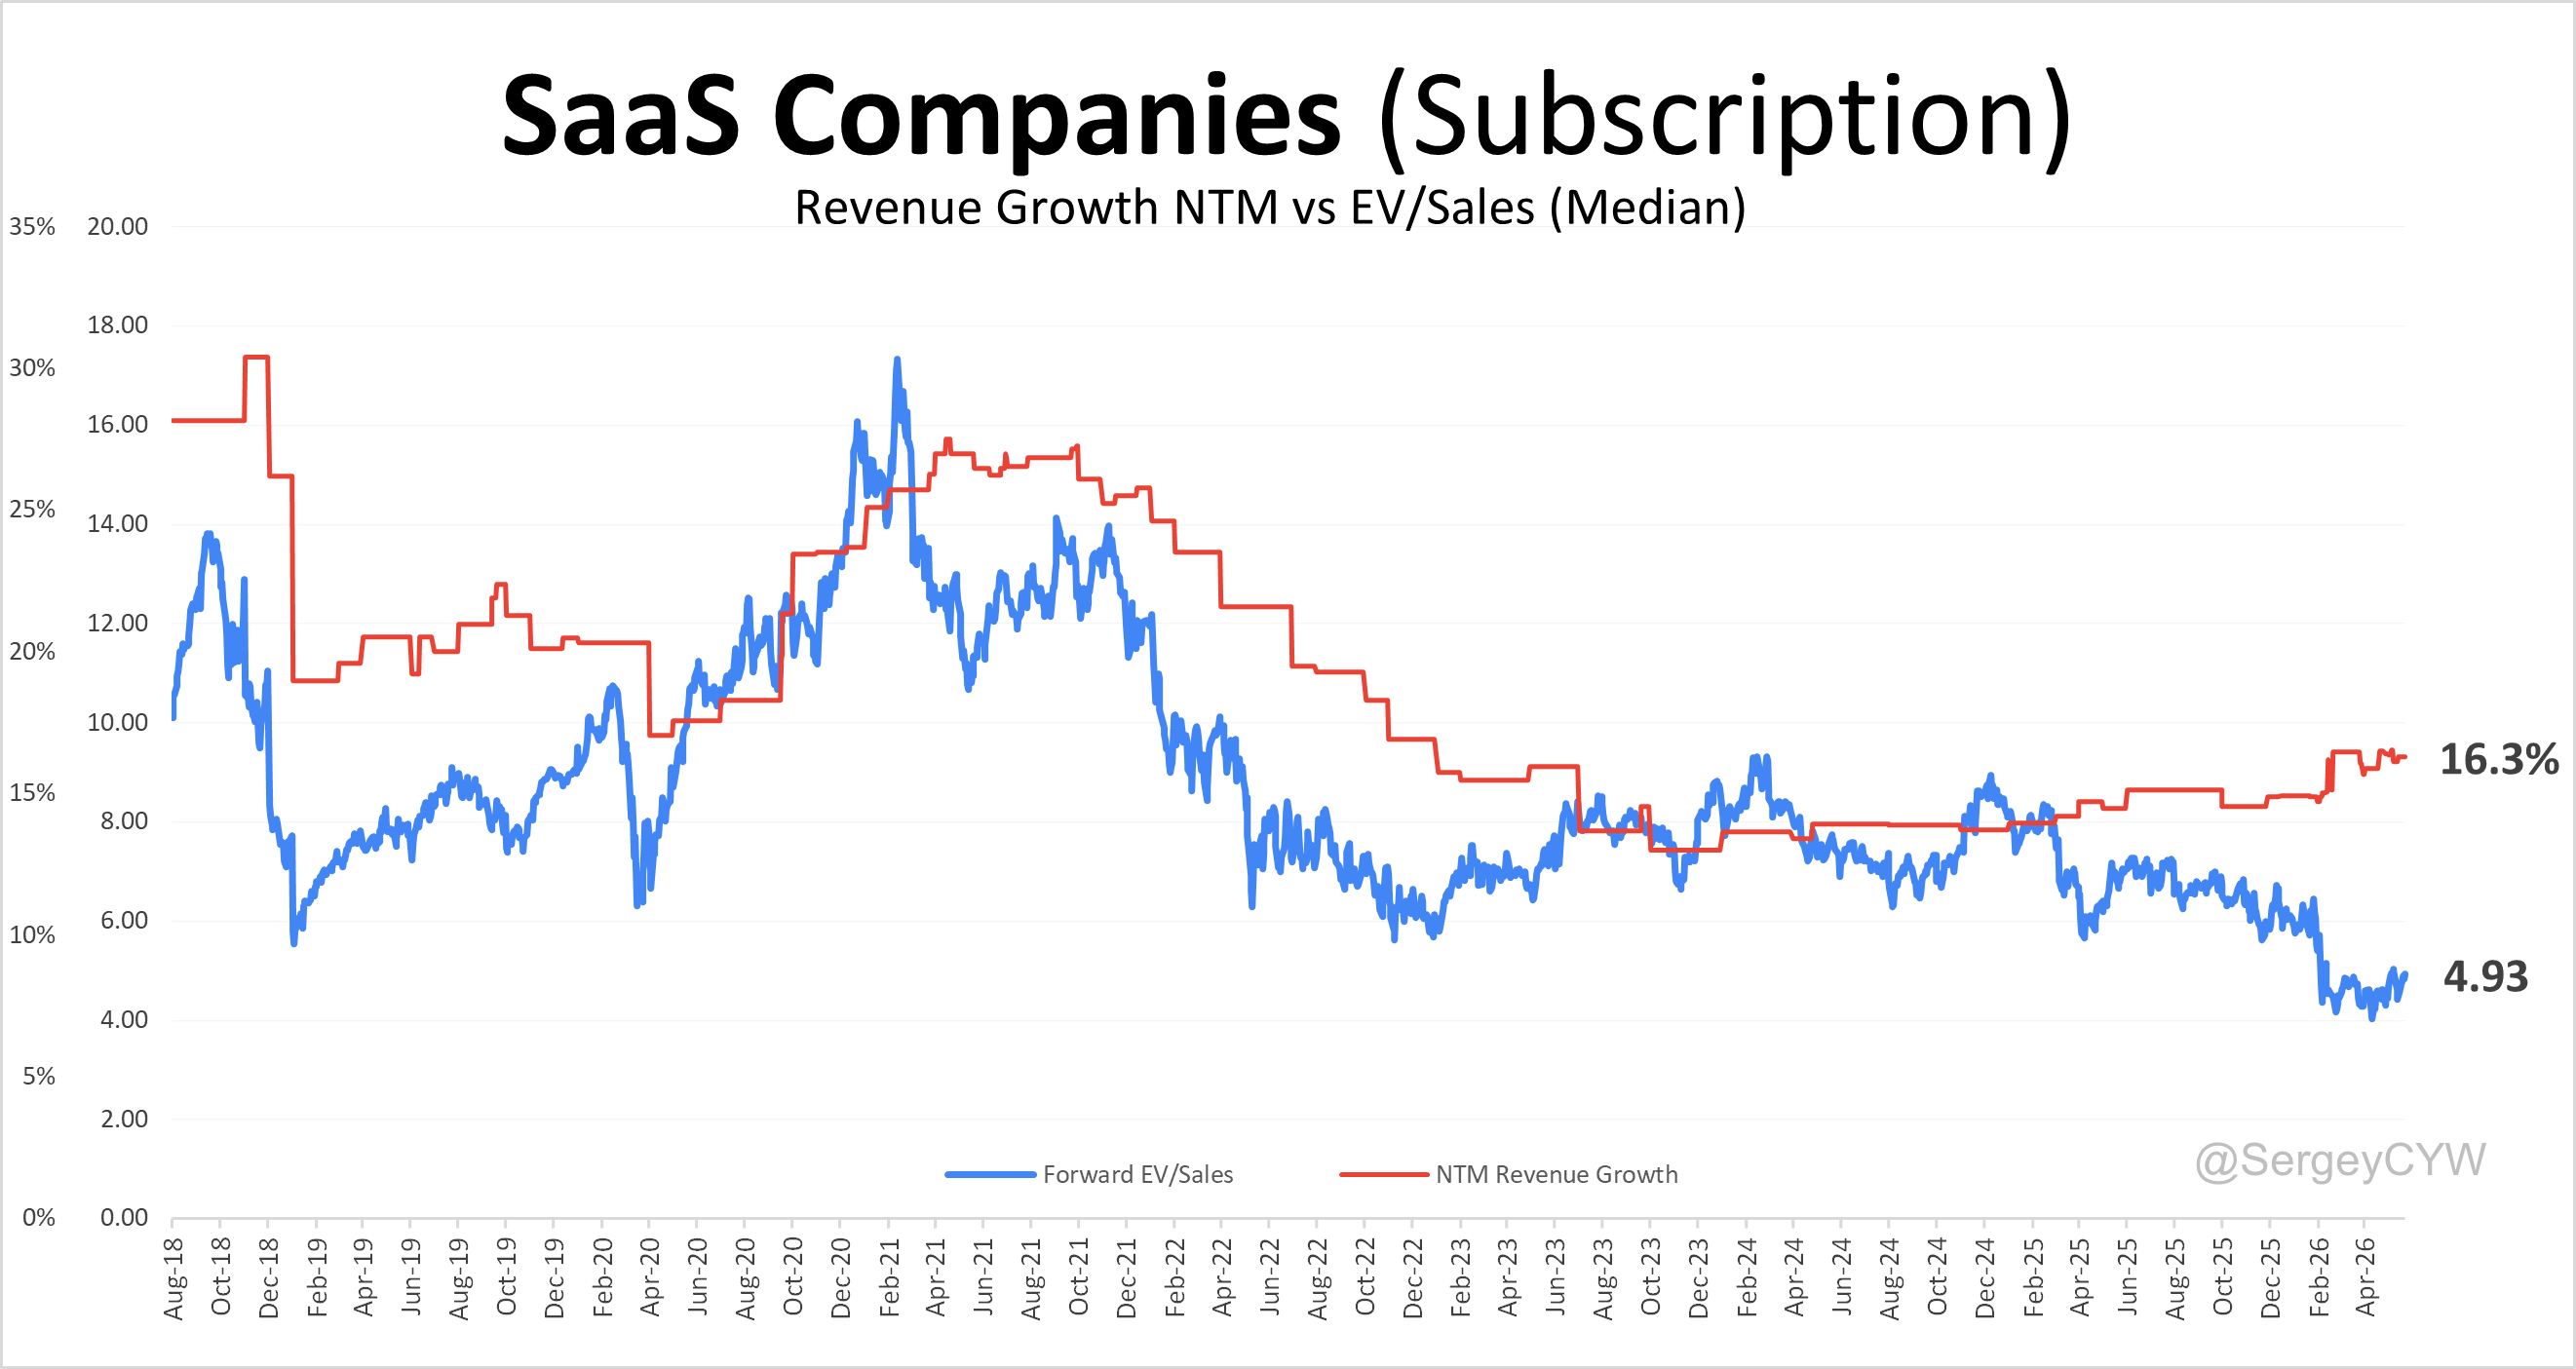
For seat-based subscription SaaS models, the median EV/Sales multiple is 3.15x, paired with 10.9% expected NTM revenue growth.
The dataset includes 36 public SaaS companies.
Dilution
Stock-Based Compensation (SBC) relative to estimated revenue growth is a key metric for assessing SaaS company efficiency and shareholder dilution.
SBC plays a vital role in attracting and retaining top talent while tying employee incentives to long-term performance.
However, it must be managed with discipline — excessive SBC can dilute shareholders and depress earnings per share, both of which weigh heavily on investor perception of financial health and sustainable value creation.
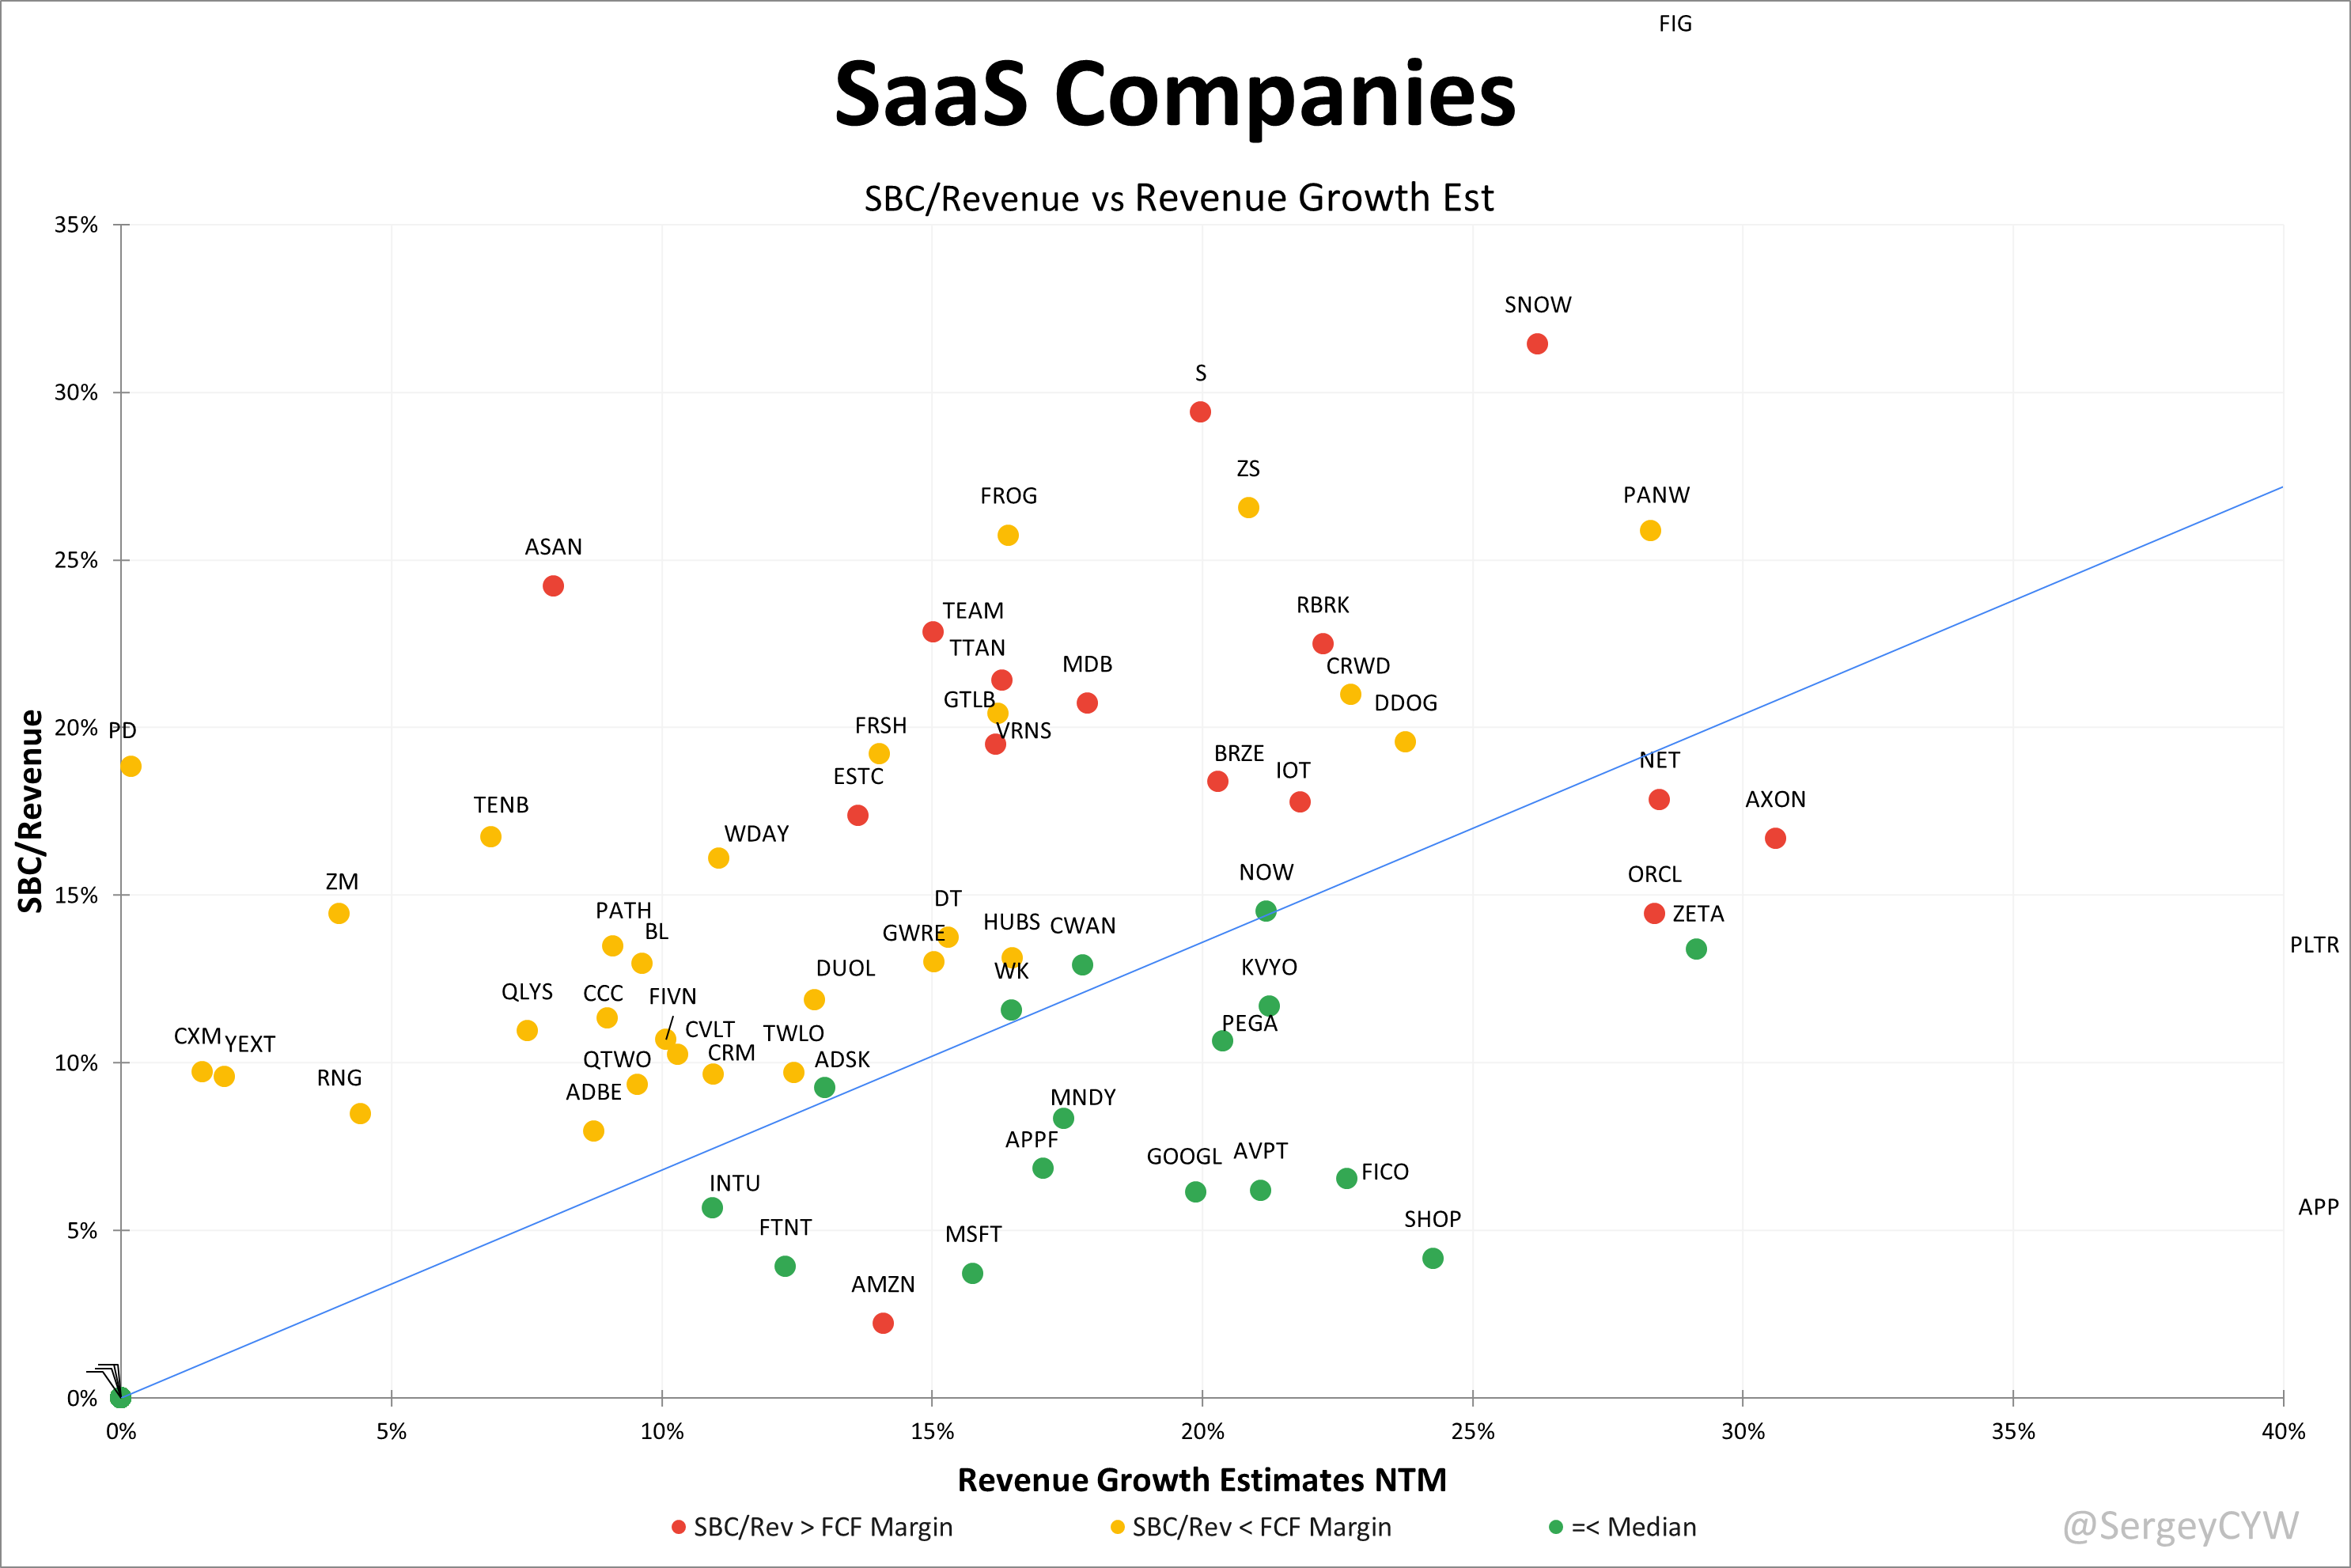
On the chart:
Red: SBC/Revenue > Free Cash Flow (FCF) margin
Yellow: SBC/Revenue < FCF margin
Green: SBC/Revenue =< Median
Outstanding share growth matters more than the absolute SBC expense because it directly reflects the erosion of shareholder ownership.
By comparing outstanding share count growth directly against estimated revenue growth, we can clearly see what portion of expected revenue expansion will be absorbed by dilution.
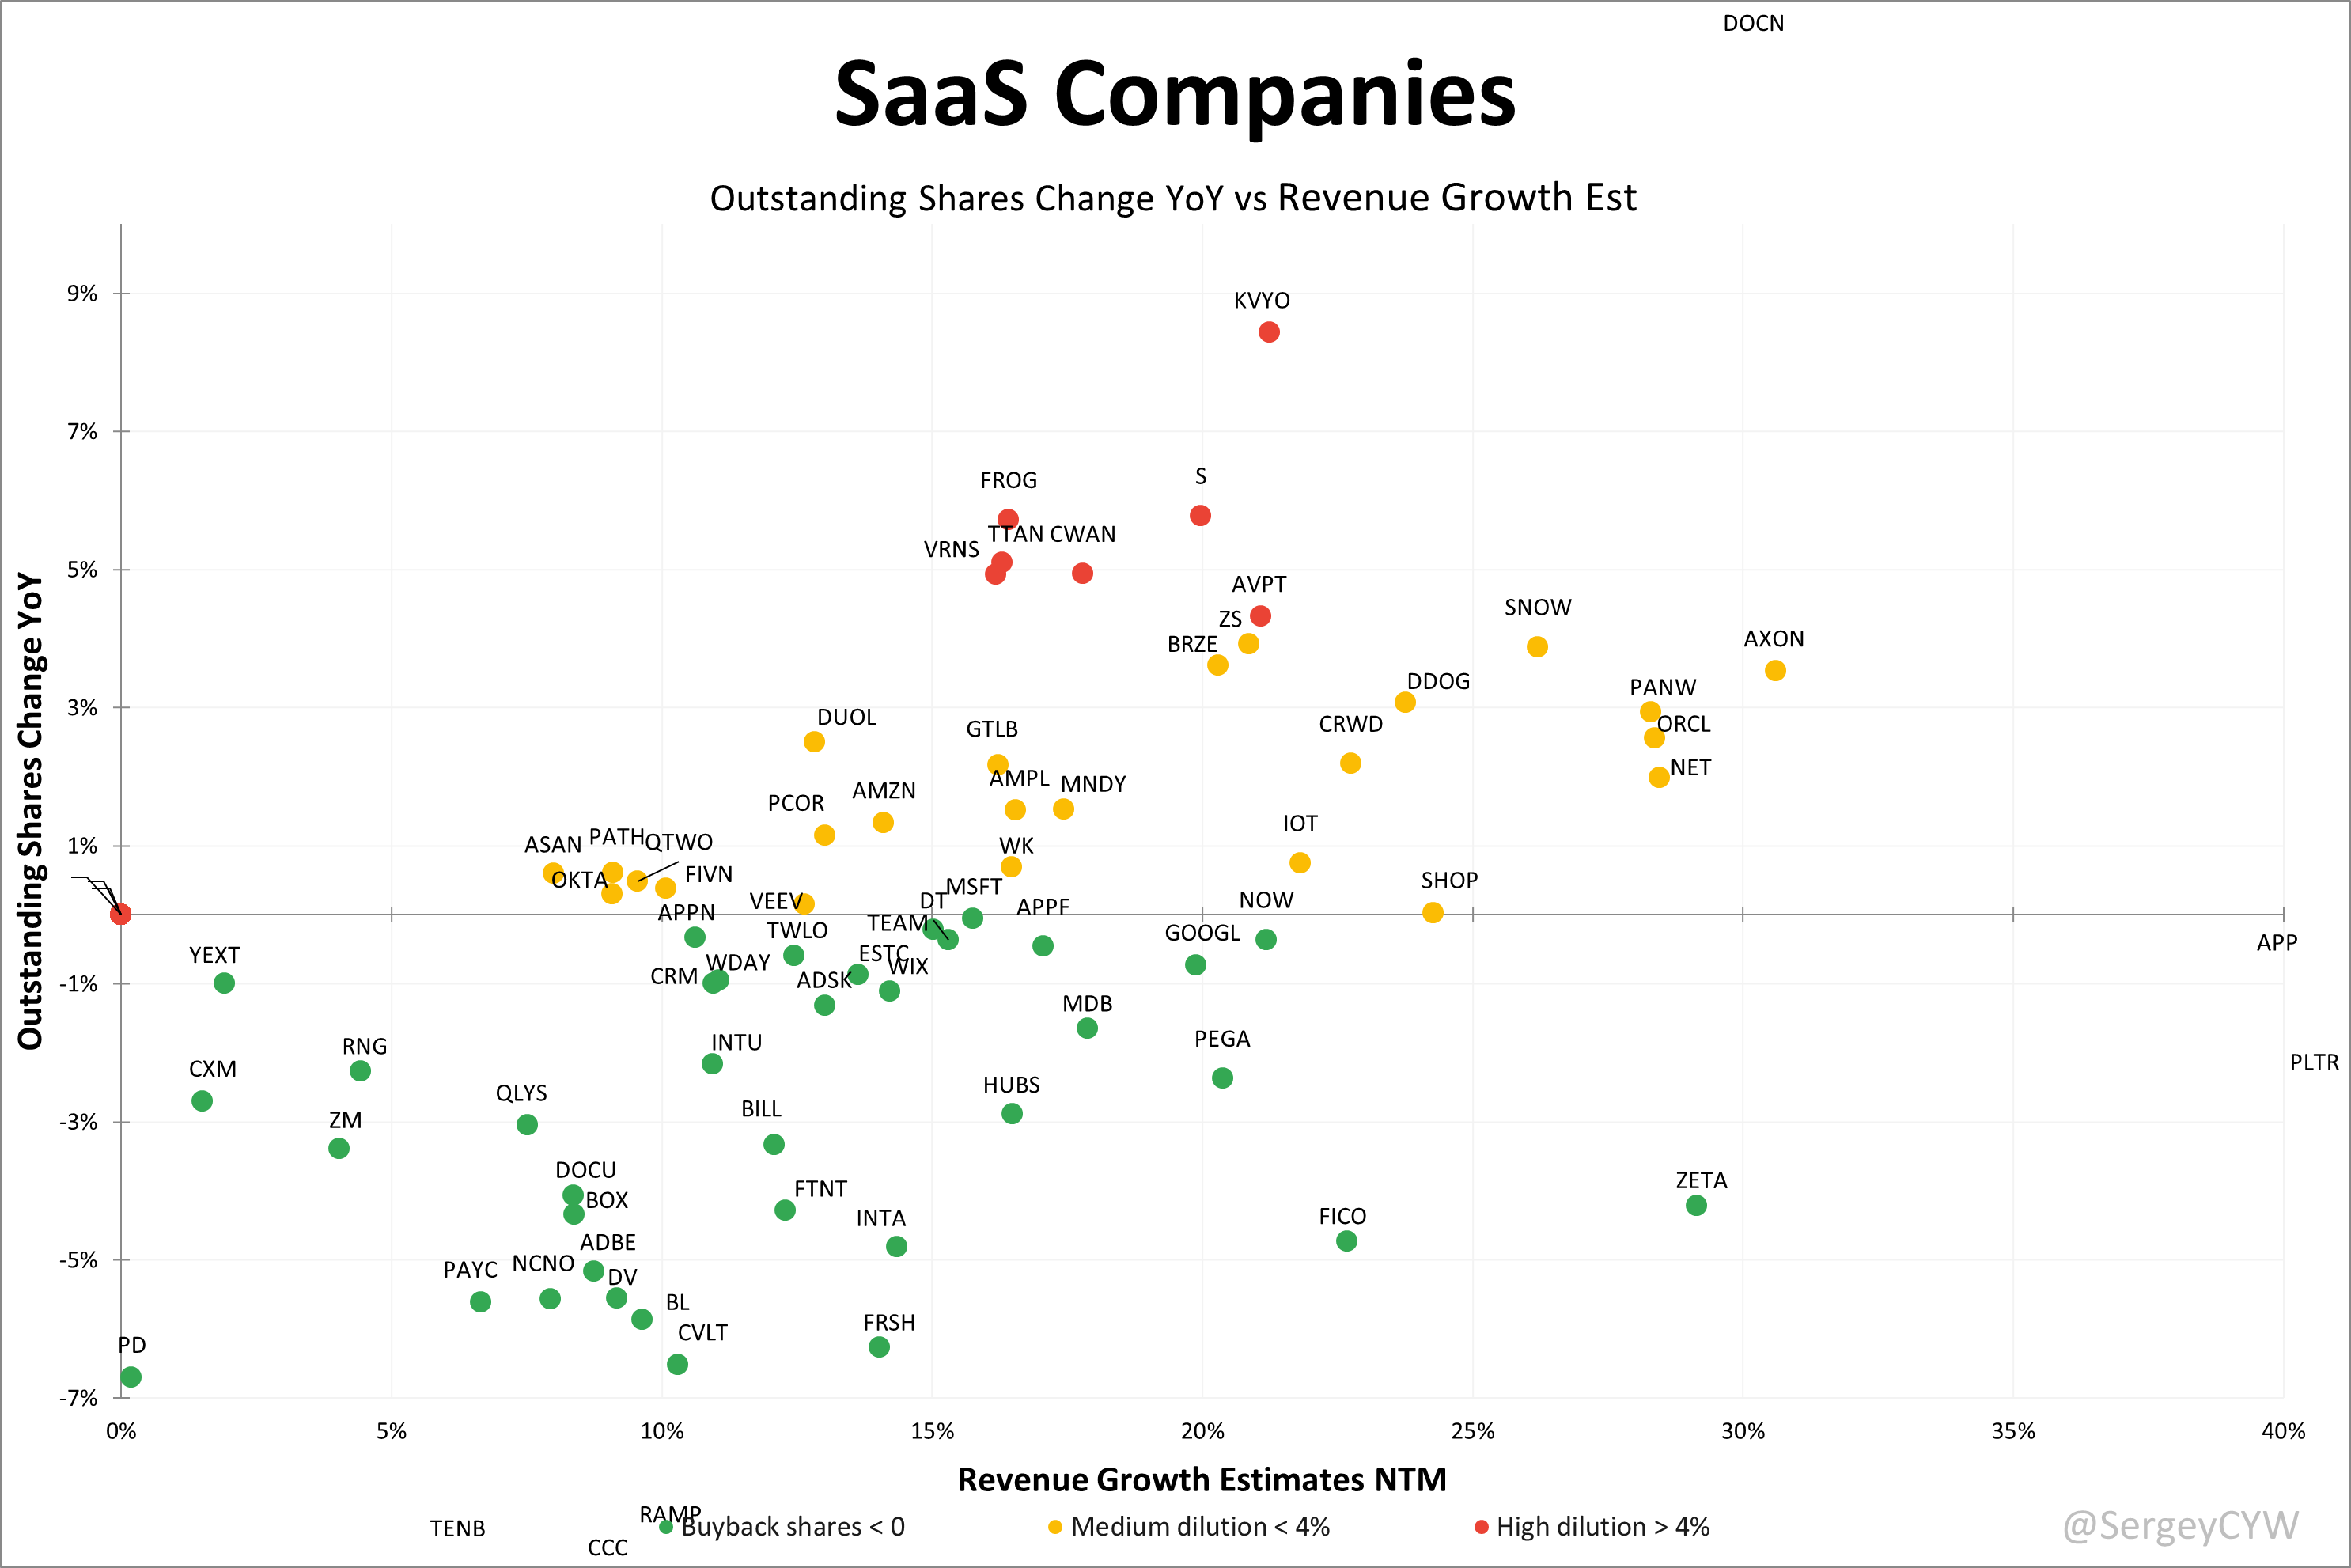
On the chart:
• Companies that buy back shares are marked in green
• Moderate dilution under 4% YoY is marked in yellow
• High dilution above 4% YoY is marked in red
Thank you for reading!
Follow me for more frequent updates on X/Twitter and Threads, and on LinkedIn. For visual infographics, check out Instagram, and for portfolio changes, follow me on SavvyTrader.
Disclaimer: This earnings review is for informational purposes only and does not constitute financial, investment, or trading advice.