
Q3 2025 SaaS Performance
Q3 2025 SaaS Deep Dive: Revenue Beats, DBNRR, CAC Payback, RDI Score, Margins, Valuation, SBC/Revenue, and Shareholder Dilution.

Is the SaaS rally masking growing inefficiencies beneath the surface? While Palantir $PLTR stole the spotlight with a stunning 8.9% revenue beat and a 6% boost in annual guidance, not every company matched that strength. Several names posted solid top-line results but lagged in operational efficiency and shareholder discipline—especially around stock-based compensation and dilution. Some, like $MDB and $CFLT, grew revenues impressively yet saw share counts balloon by more than 6%, raising sustainability questions.
This report examines a wide range of top SaaS names, including $CRWD, $PLTR, $AXON, $NET, $ZS, $S, $SNOW, $MDB, and $NOW, among others.
Table of Contents
Revenue Forecast Outperformance
Changes to Annual Guidance
Dollar-Based Net Retention Rate (DBNRR)
Expense Prioritization: R&D vs. S&M
CAC Payback Period
R&D Index (RDI Score)
SaaS Magic Number
Margins and Profitability
Stock-Based Compensation and Dilution
Valuations: Price/Gross Profit, Rule of 40, and PSG
Closing Thoughts
Let’s explore the key metrics—Dollar-Based Net Retention Rate (DBNRR), Customer Acquisition Cost (CAC) Payback Period, Gross and Operating Margins, R&D Efficiency, Stock-Based Compensation (SBC), Dilution, and Valuation—that offer a comprehensive view into the underlying business quality and market positioning of these companies.
Revenue Forecast Outperformance
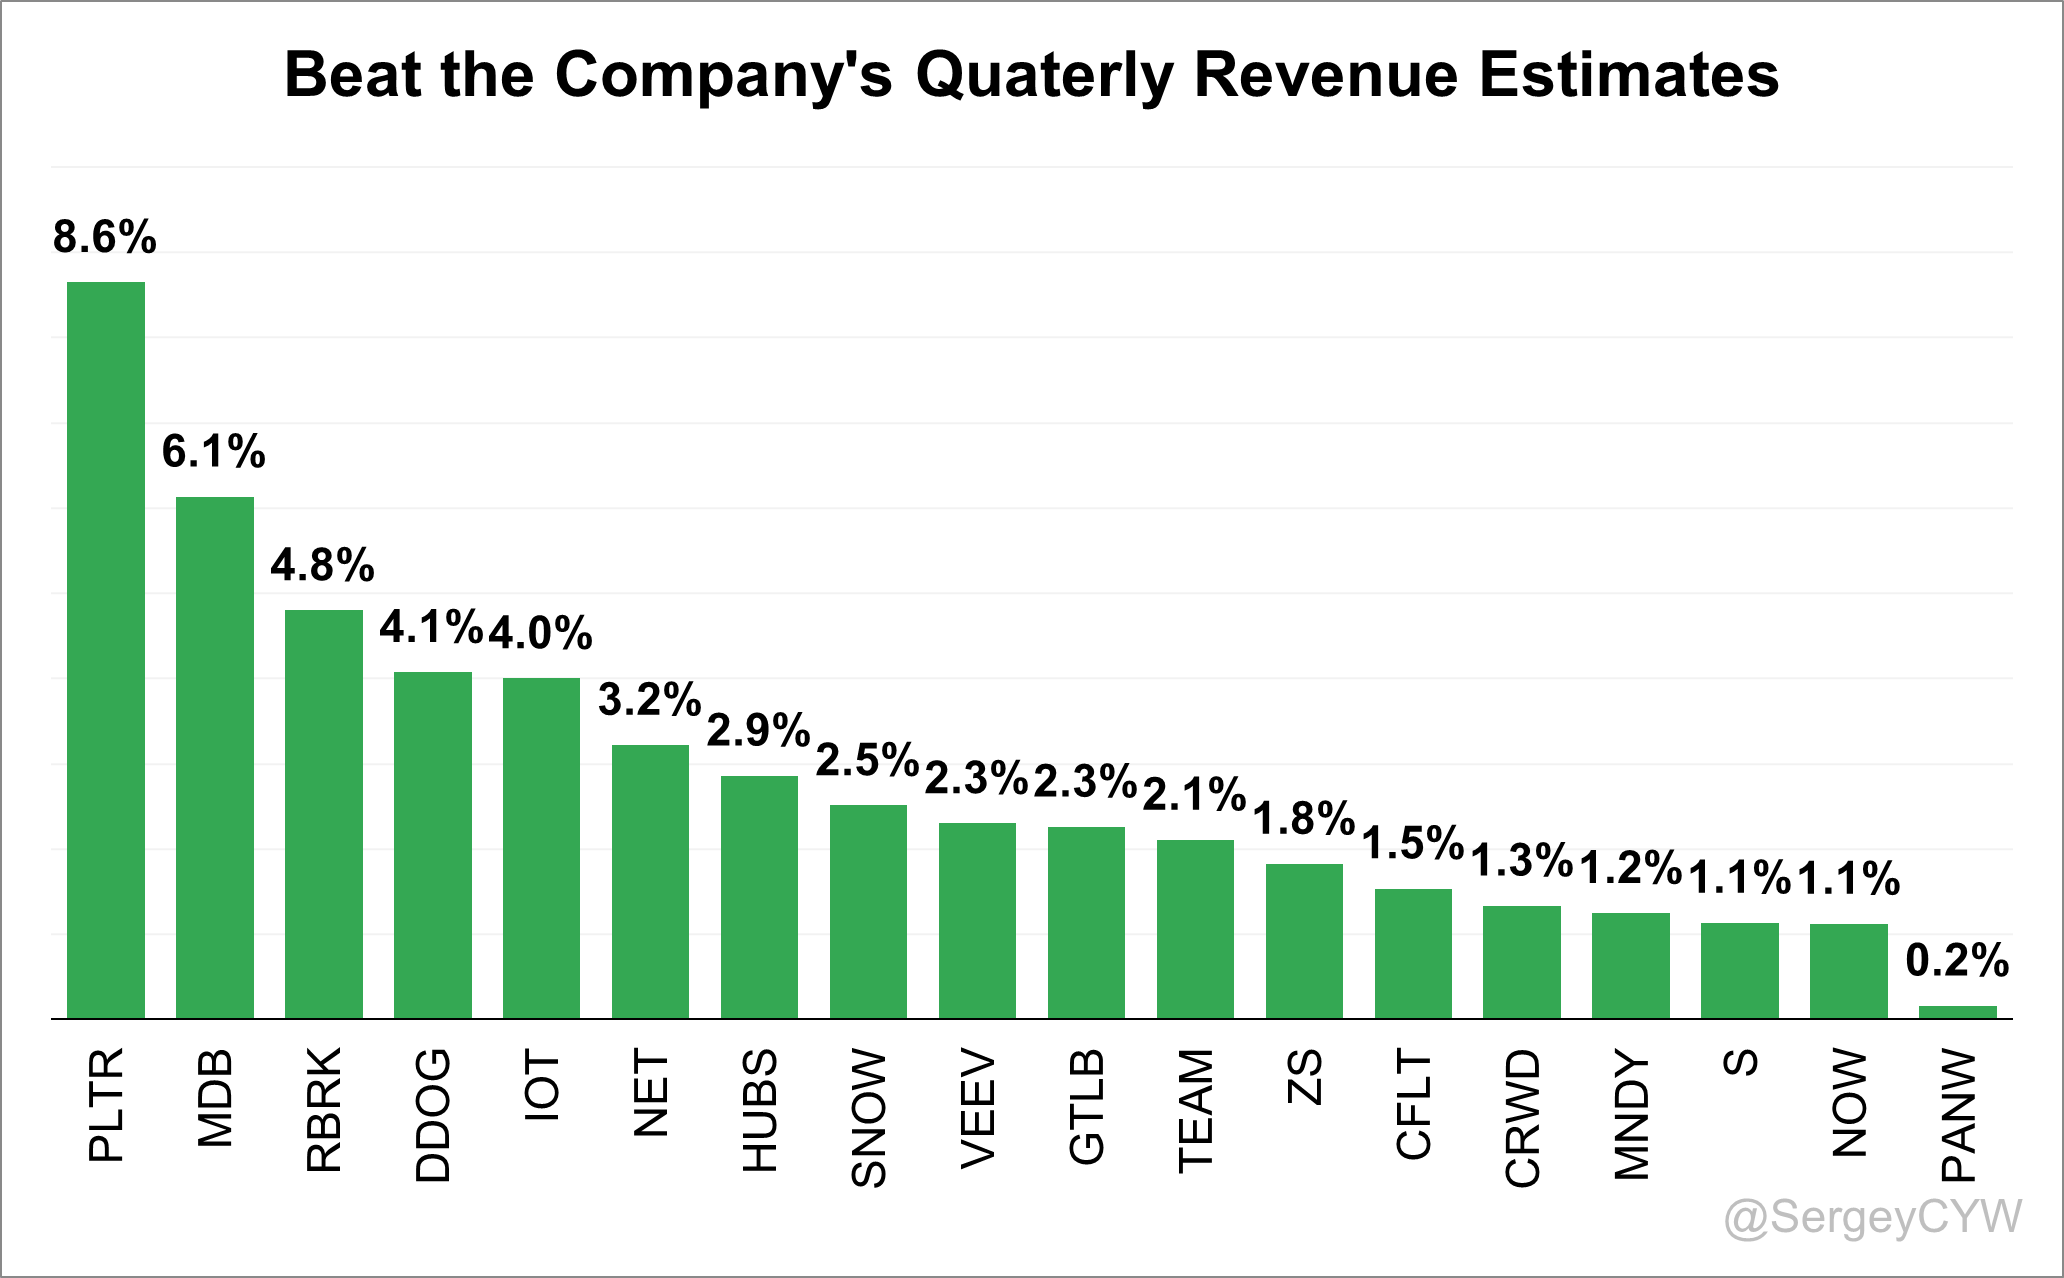
The quarter began with $PLTR delivered the largest revenue beat at 8.9%, followed by $MDB with a 6.1% beat. Next were $RBRK (4.8%), $DDOG (4.1%), and $IOT (4.0%).
Other notable outperformers included $NET, $HUBS, $SNOW, $VEEV, $GTLB, $TEAM, $ZS, $CFLT, and $CRWD, with revenue beats ranging from 3.2% down to 1.3%.
Smaller but still meaningful outperformance came from $MNDY, $S, and $NOW, each exceeding their forecasts by roughly 1.0%.
$PANW also exceeded its revenue forecast—though only by 0.2%.
Revenue beats across the sector signal resilient demand, especially given macro pressures, but the real story lies in how companies adjusted their annual forecasts.
Changes to Annual Guidance
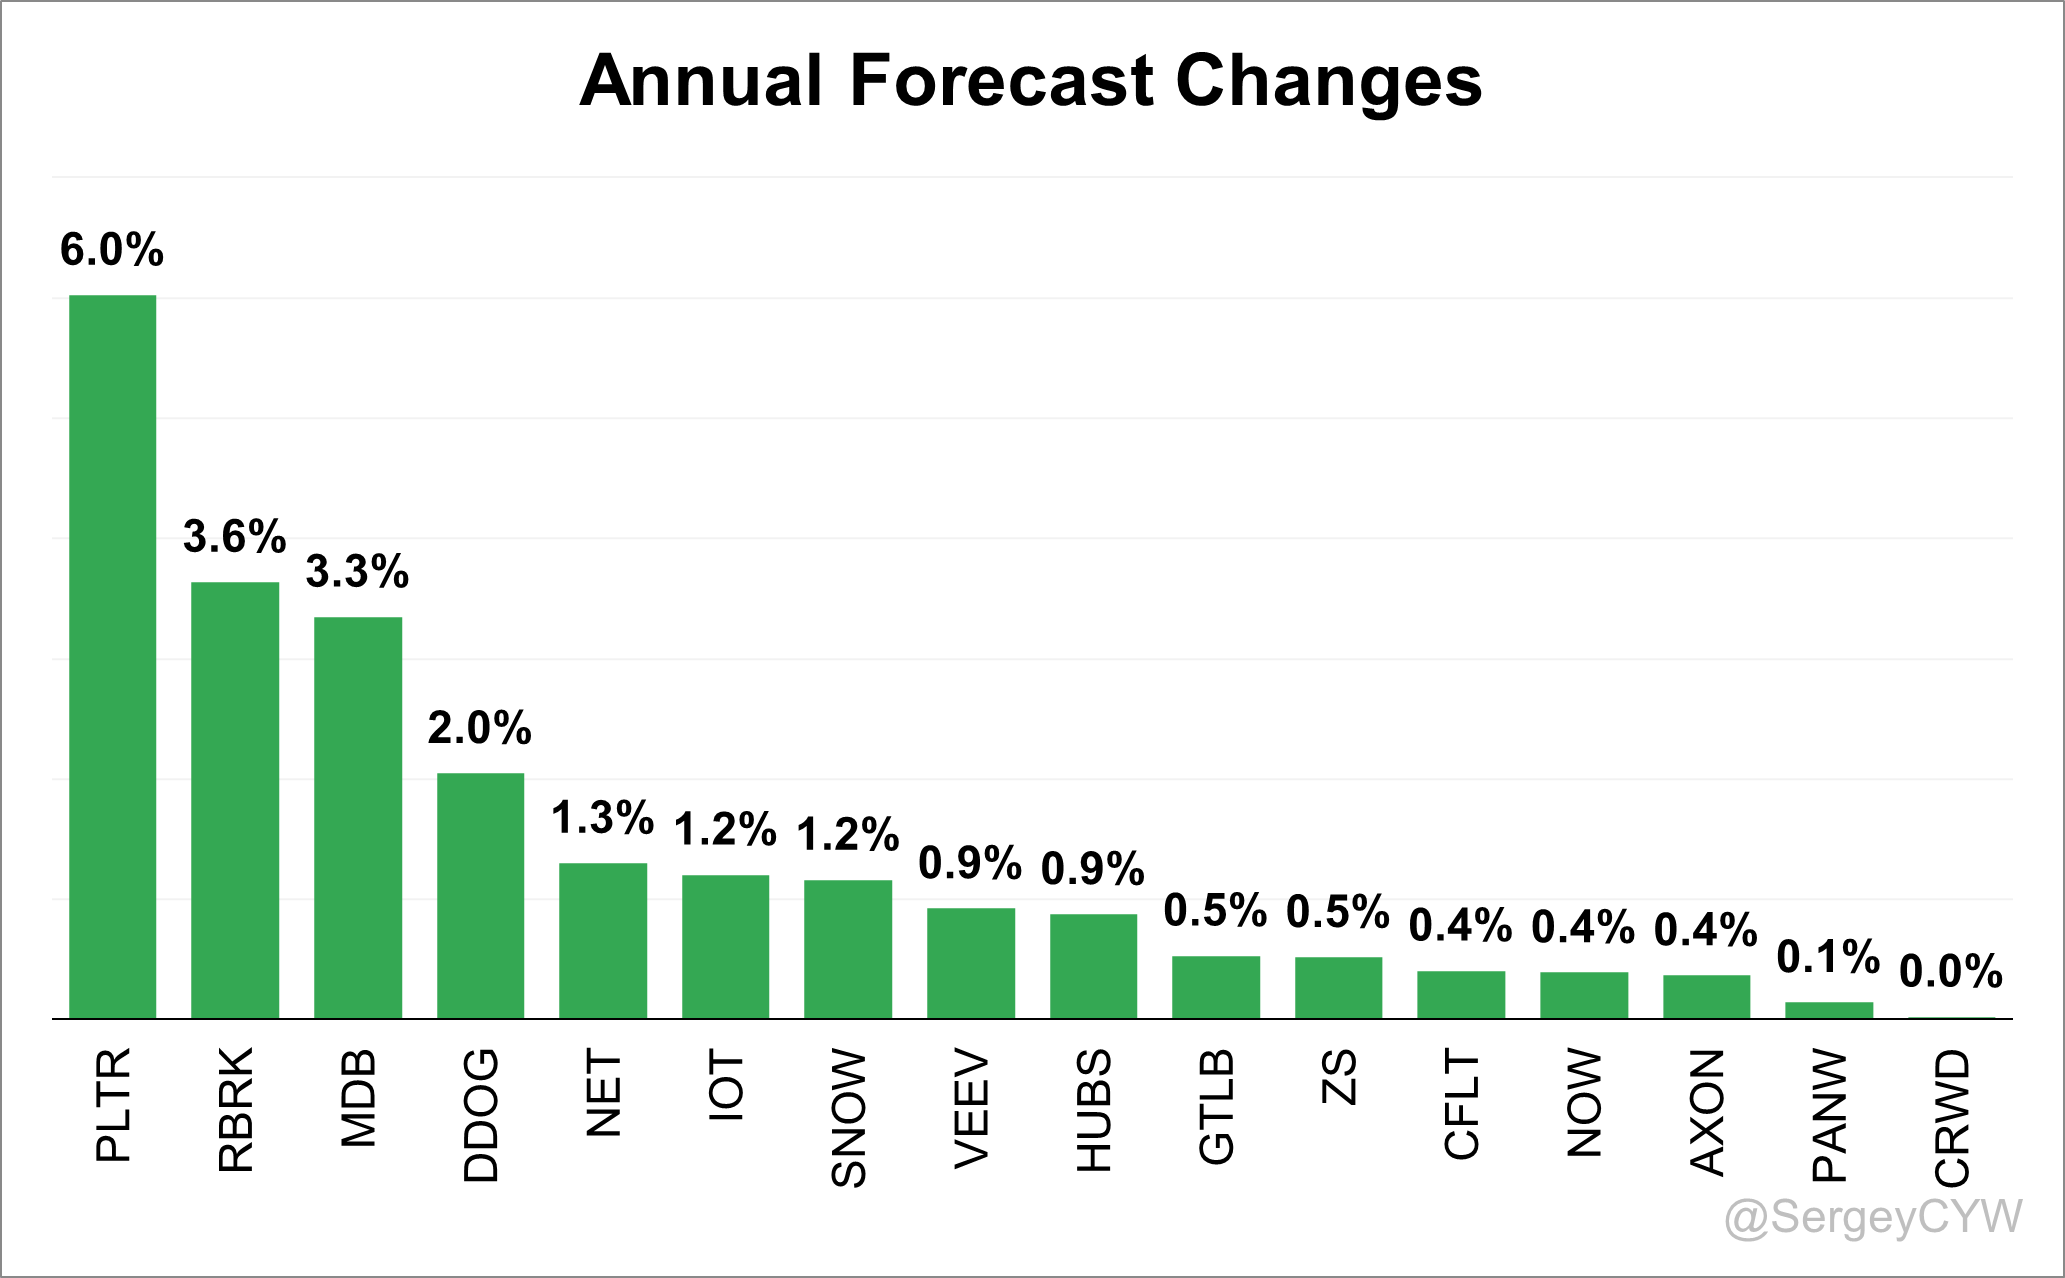
The most notable upward revision came from $PLTR, which raised its forecast by 6.0%, after a 6.4% increase in Q2.
Following that, $RBRK, $MDB, and $DDOG each increased their guidance by more than 2.0%.
$NET, $IOT, $SNOW, and $VEEV raised their guidance by around 1%.
Companies such as $GTLB, $CFLT, $NOW, $AXON, and $PANW adjusted their full-year outlooks upward by 0.5% to 0.1%.
$CRWD did not revise its annual forecast, keeping it unchanged.
Dollar-Based Net Retention Rate (DBNRR)
Focusing on the Dollar-Based Net Retention Rate (DBNRR), this metric is crucial for SaaS companies as it reflects customer loyalty and product stickiness. It measures the revenue retained from existing customers over a specific period, accounting for upgrades, downgrades, and churn.
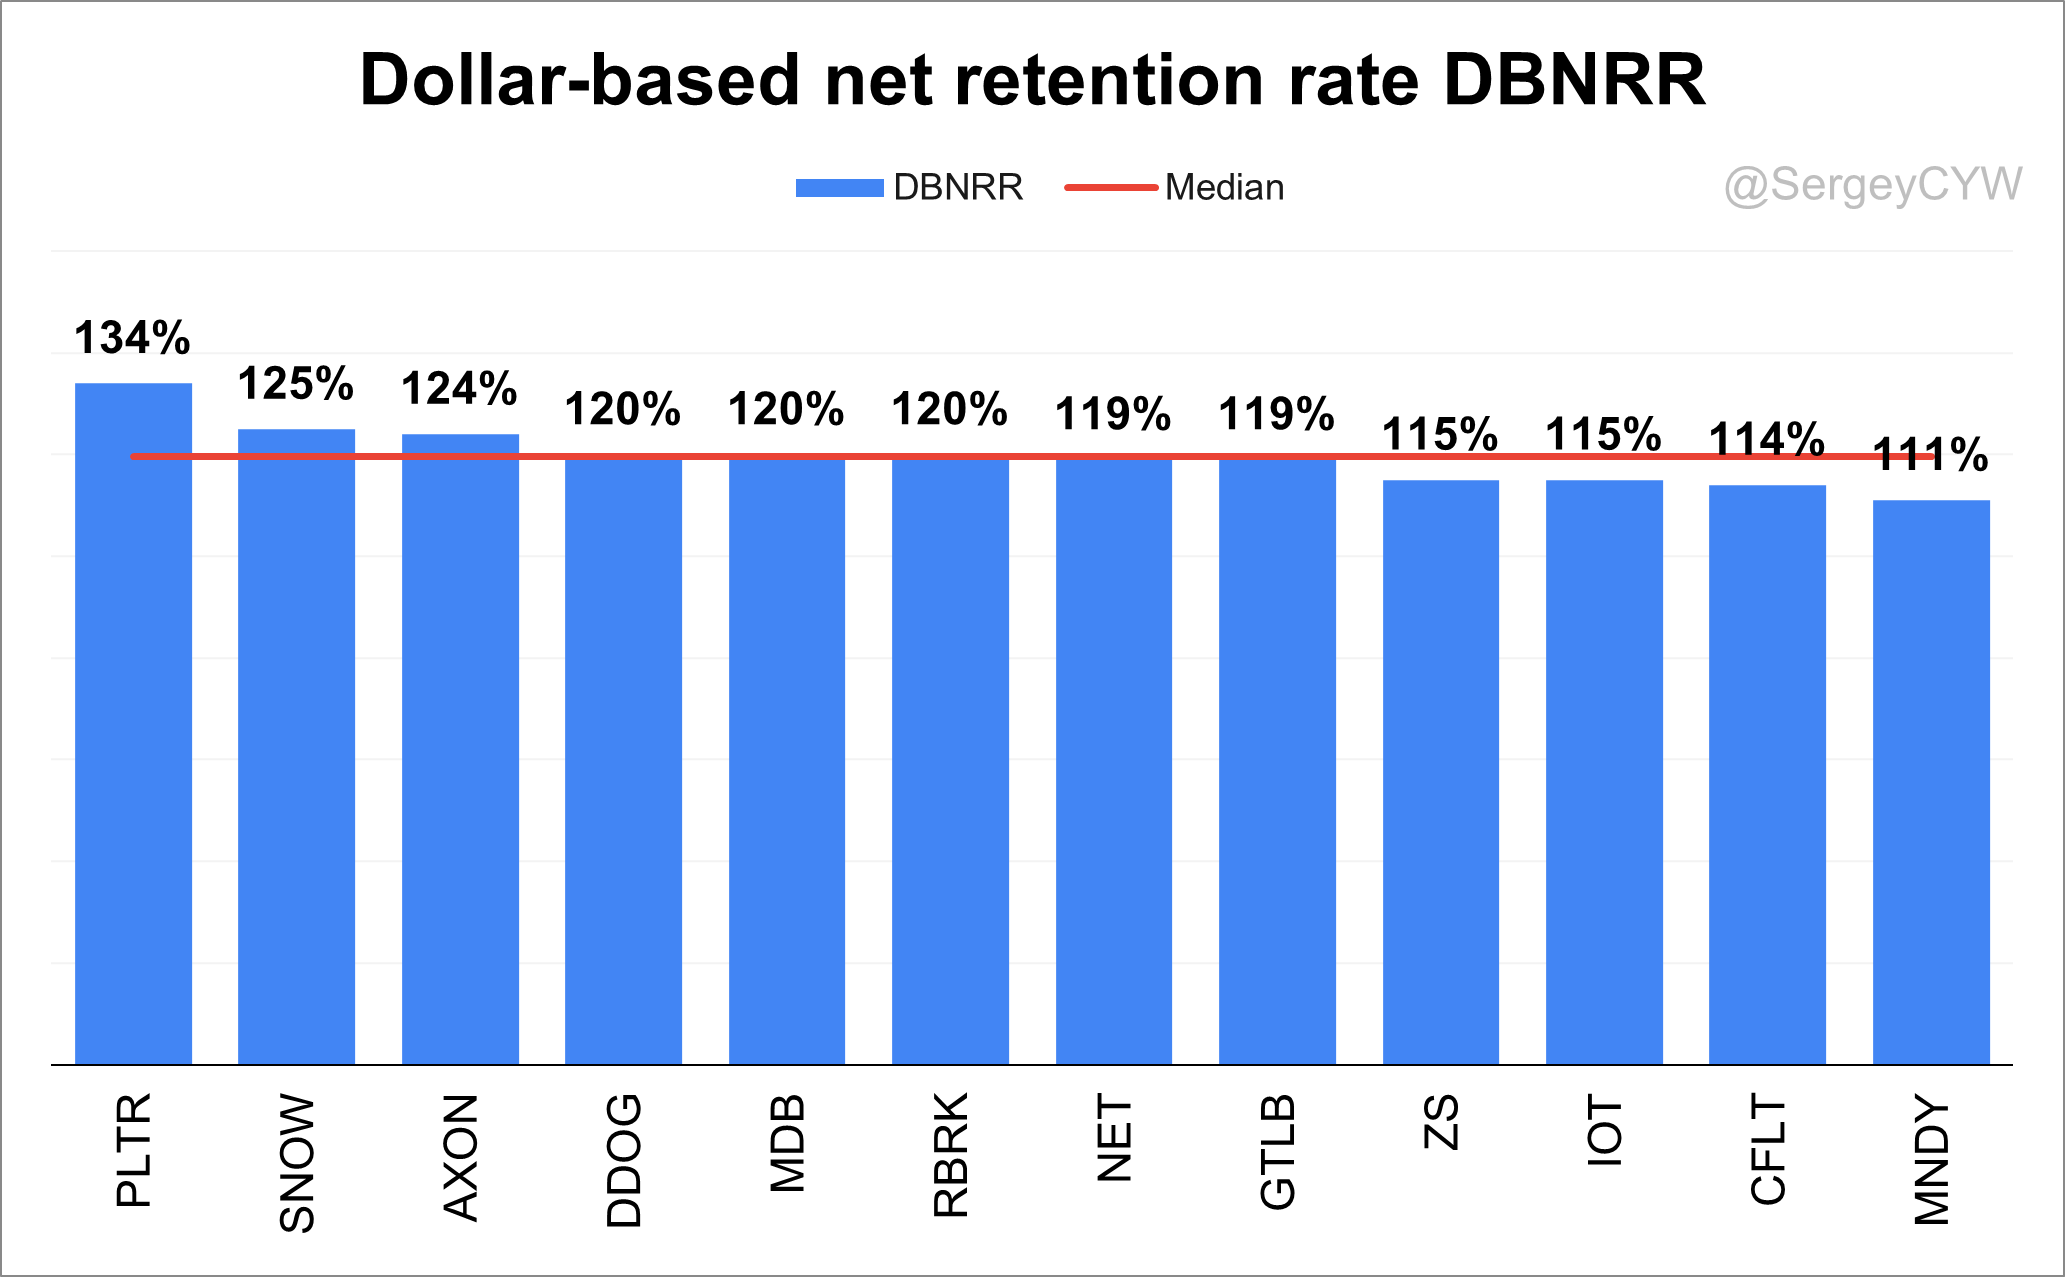
The median DBNRR among the SaaS companies I track is 120%, up from 119% in Q1.
Among the highest performers, $PLTR lead with 134%, and $SNOW with 125% followed closely by $AXON at 124%.
At the median level are $DDOG, $MDB, $RBRK at 120%, and $NET, $GTLB at 119%.
Just below the median, but still solid, are $ZS, $IOT at 115%, and $CFLT at 114%.
On the lower end, $MNDY reports 111%, though it’s worth noting that $MNDY’s DBNRR for medium and large customers is stronger at 117%.
Expense Prioritization: R&D vs. S&M
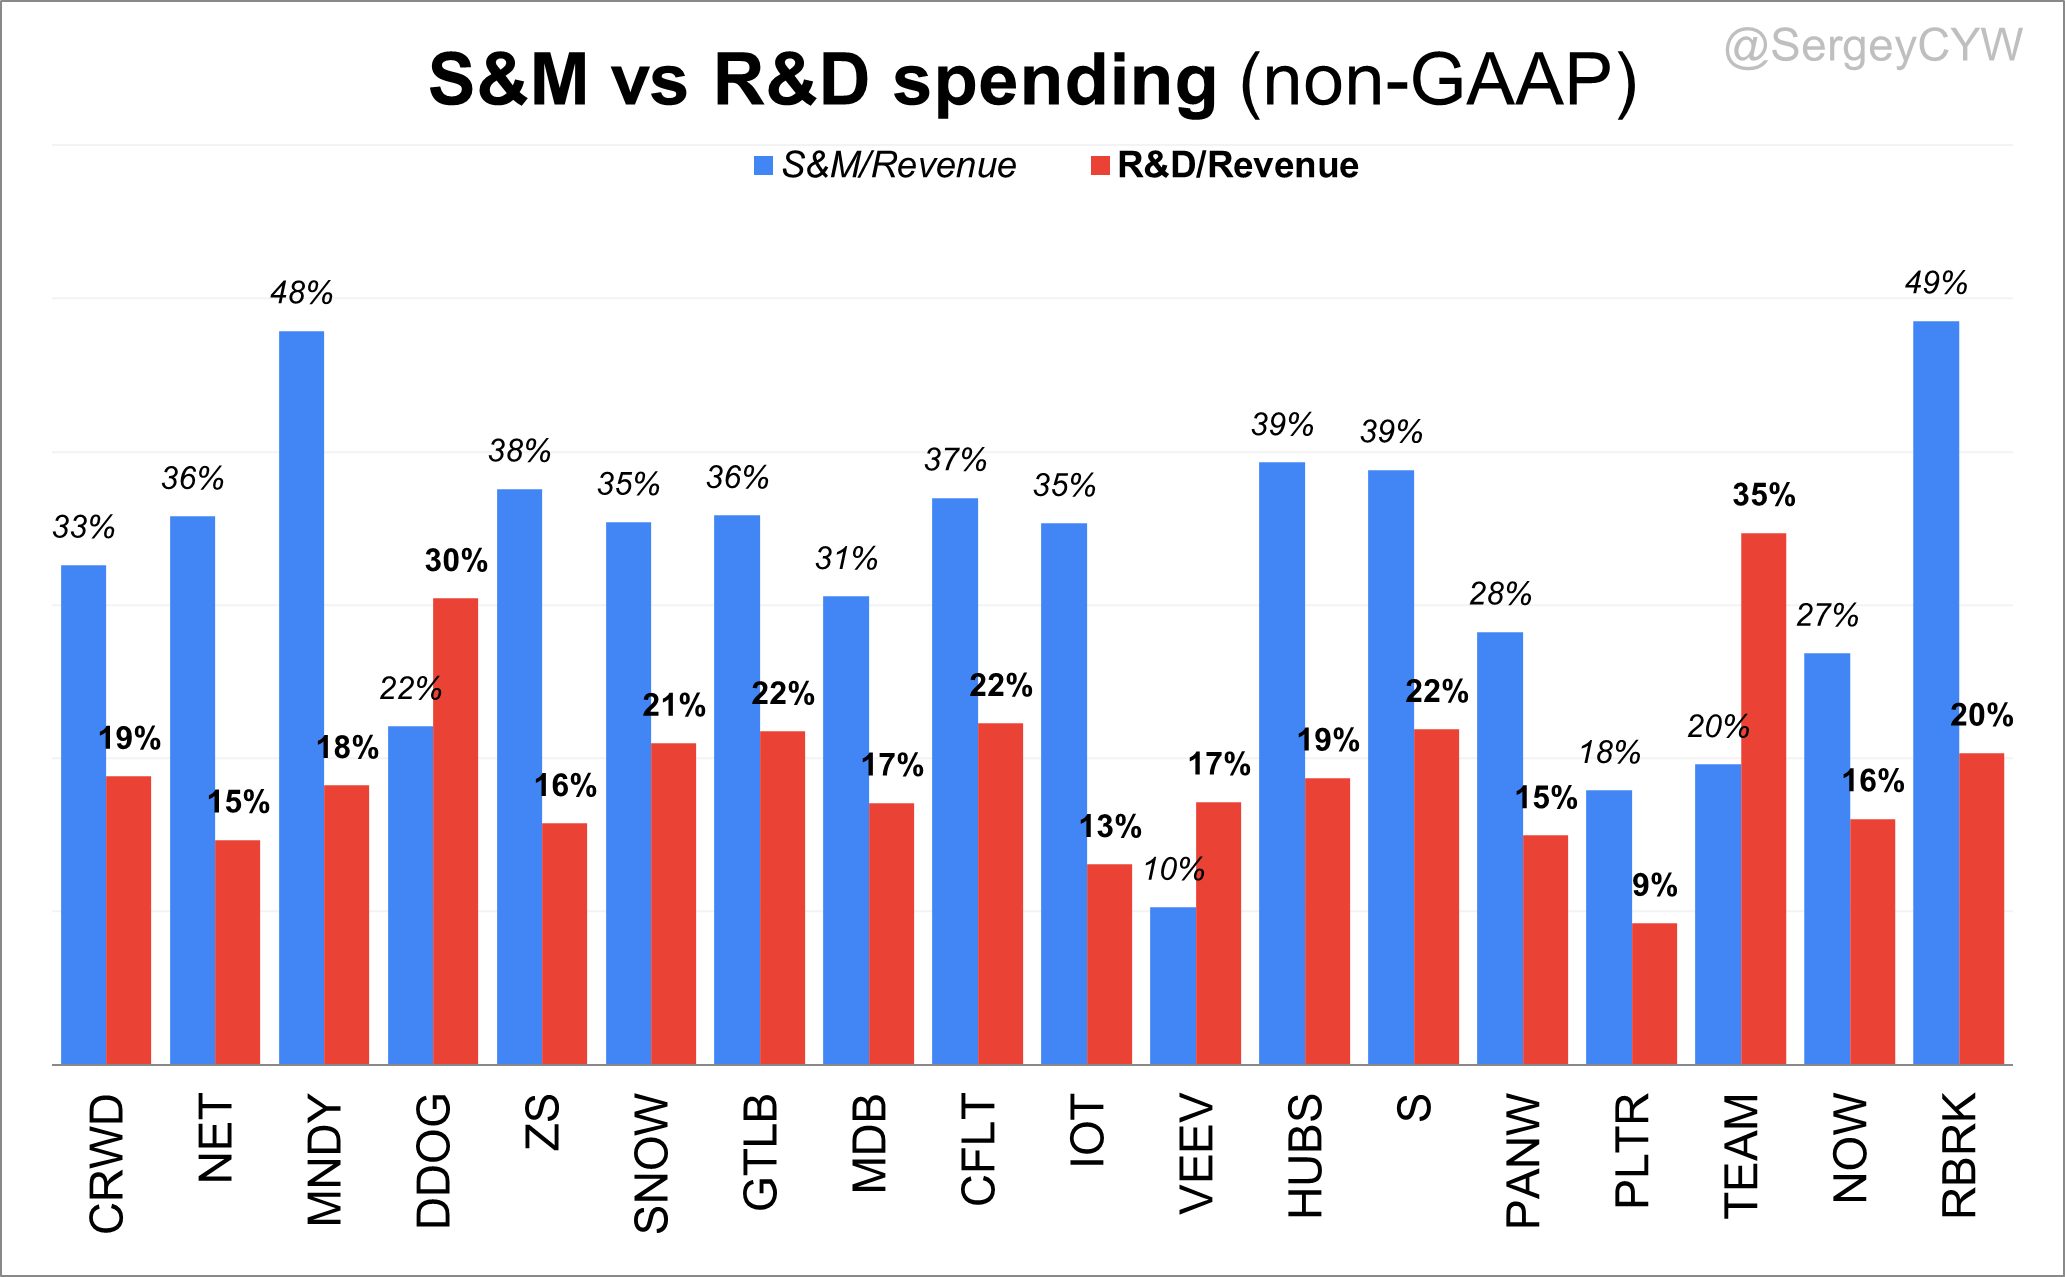
Product-led growth companies thrive when R&D takes precedence over Sales & Marketing. Firms like $DDOG, $TEAM, and $VEEV spend more on R&D than S&M, prioritizing innovation over customer acquisition.
This strategy builds stronger product moats, improves retention, and reduces reliance on costly marketing campaigns. Over time, such companies often benefit from superior margins and more sustainable growth paths.
CAC Payback Period
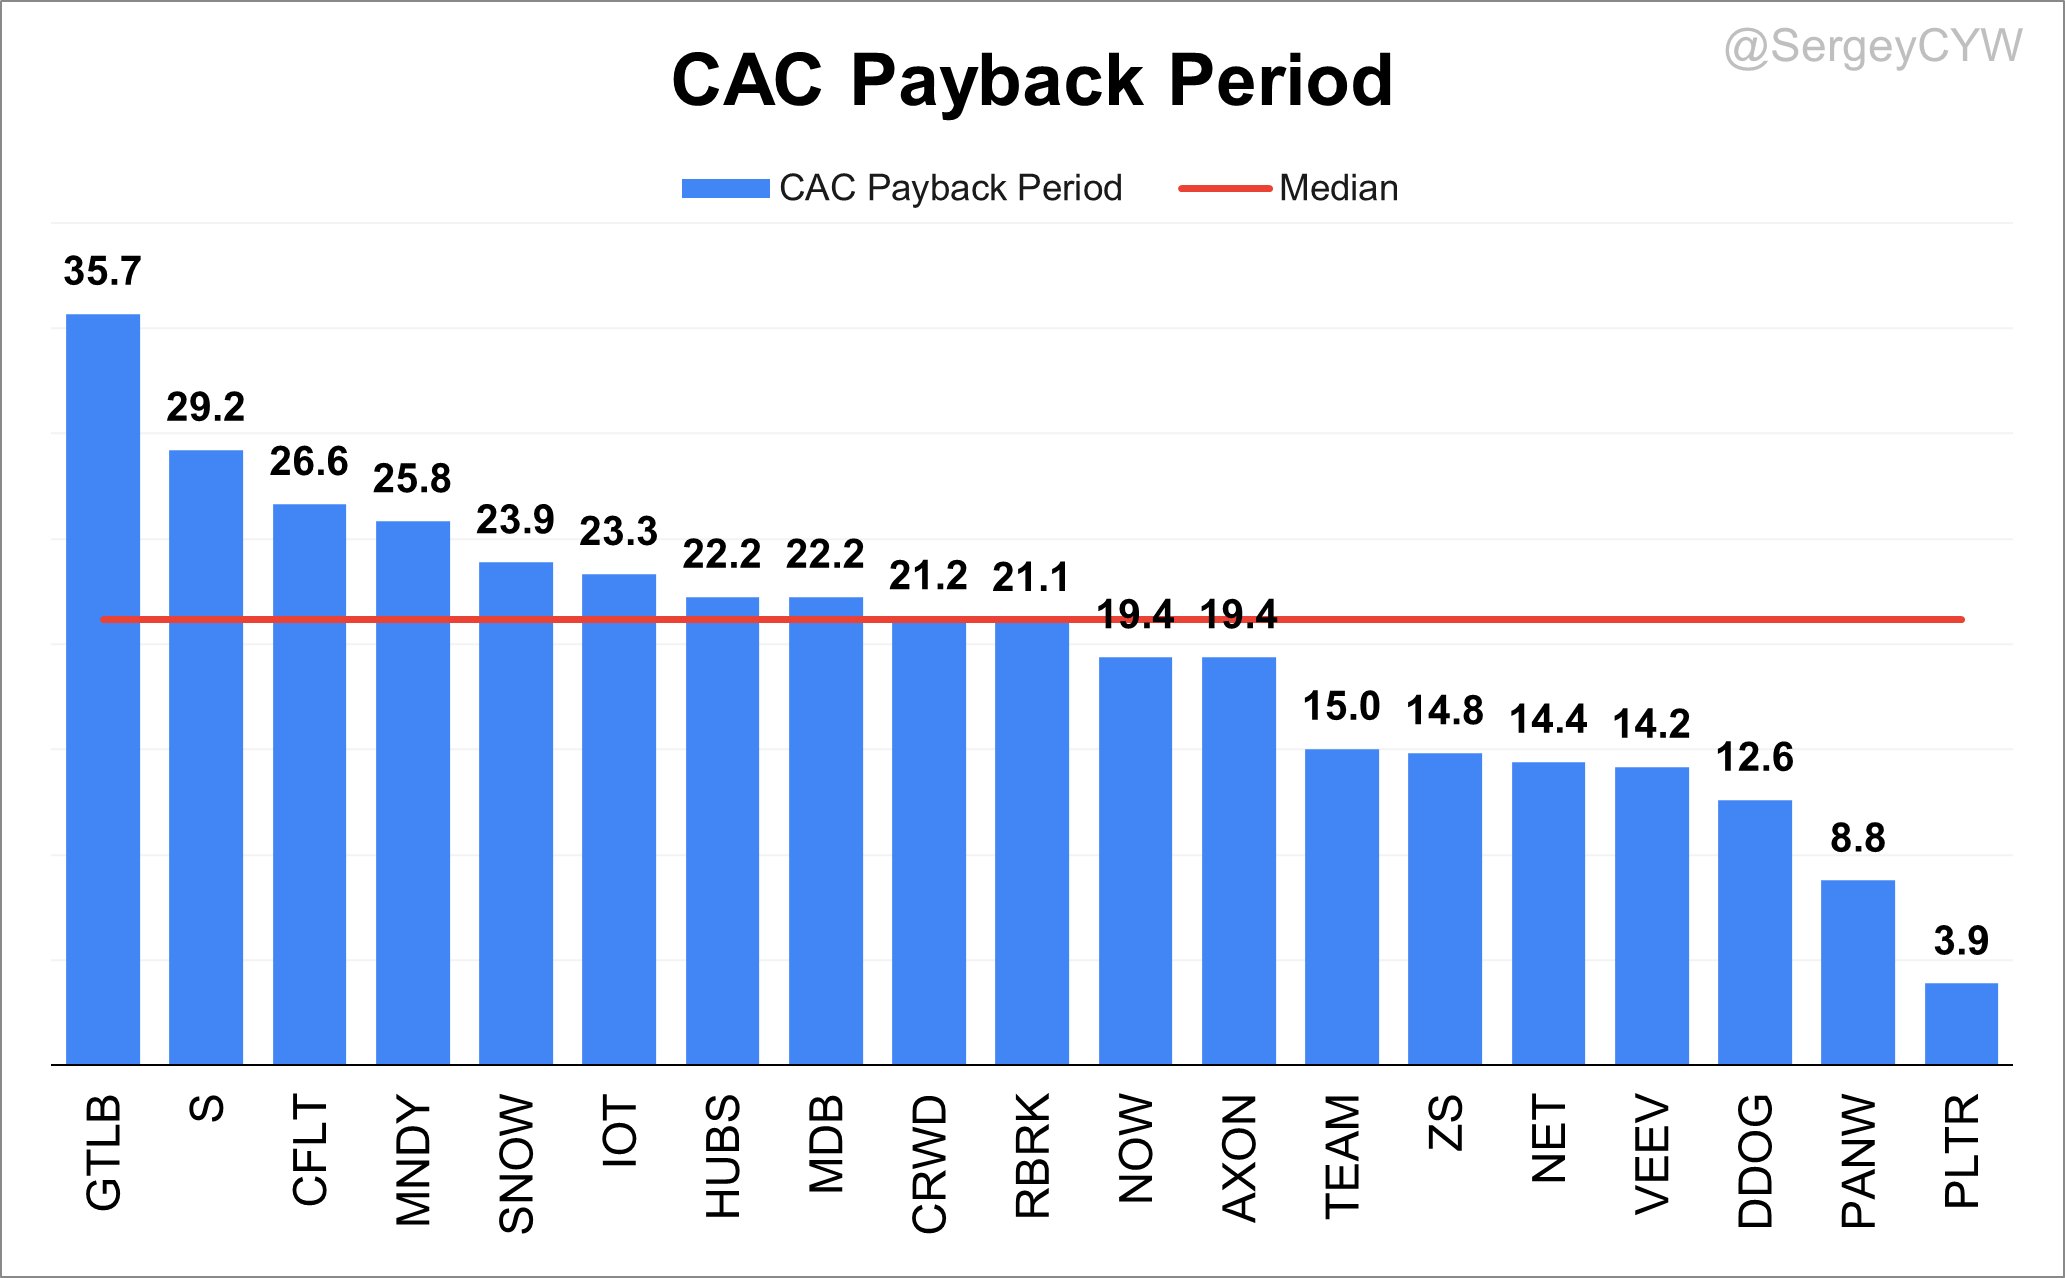
The Customer Acquisition Cost (CAC) Payback Period is a crucial metric for SaaS companies, measuring the time (in months) it takes to recover the cost of acquiring new customers.
This metric is essential for evaluating the efficiency of a company’s sales and marketing efforts. A shorter CAC Payback Period generally indicates a more effective go-to-market strategy and a product that resonates well with customers.
In Q3 2025, the companies with the least favorable CAC Payback Periods included $GTLB at 35.7 months, $S at 29.2 months, $CFLT at 26.6 months, and $MNDY at 25.8 months.
On the other hand, the best performers were $PLTR with a payback period of 3.9 months, $PANW at 8.8 months, $DDOG at 12.6 months, and $VEEV at 14.2 months.
The median CAC Payback Period for the SaaS companies I monitor stands at 21.1 months, up from 21.6 months in the previous quarter.
Companies performing around the median include $NET, $ZS, $IOT, $TEAM, and $HUBS.
R&D Index (RDI Score)
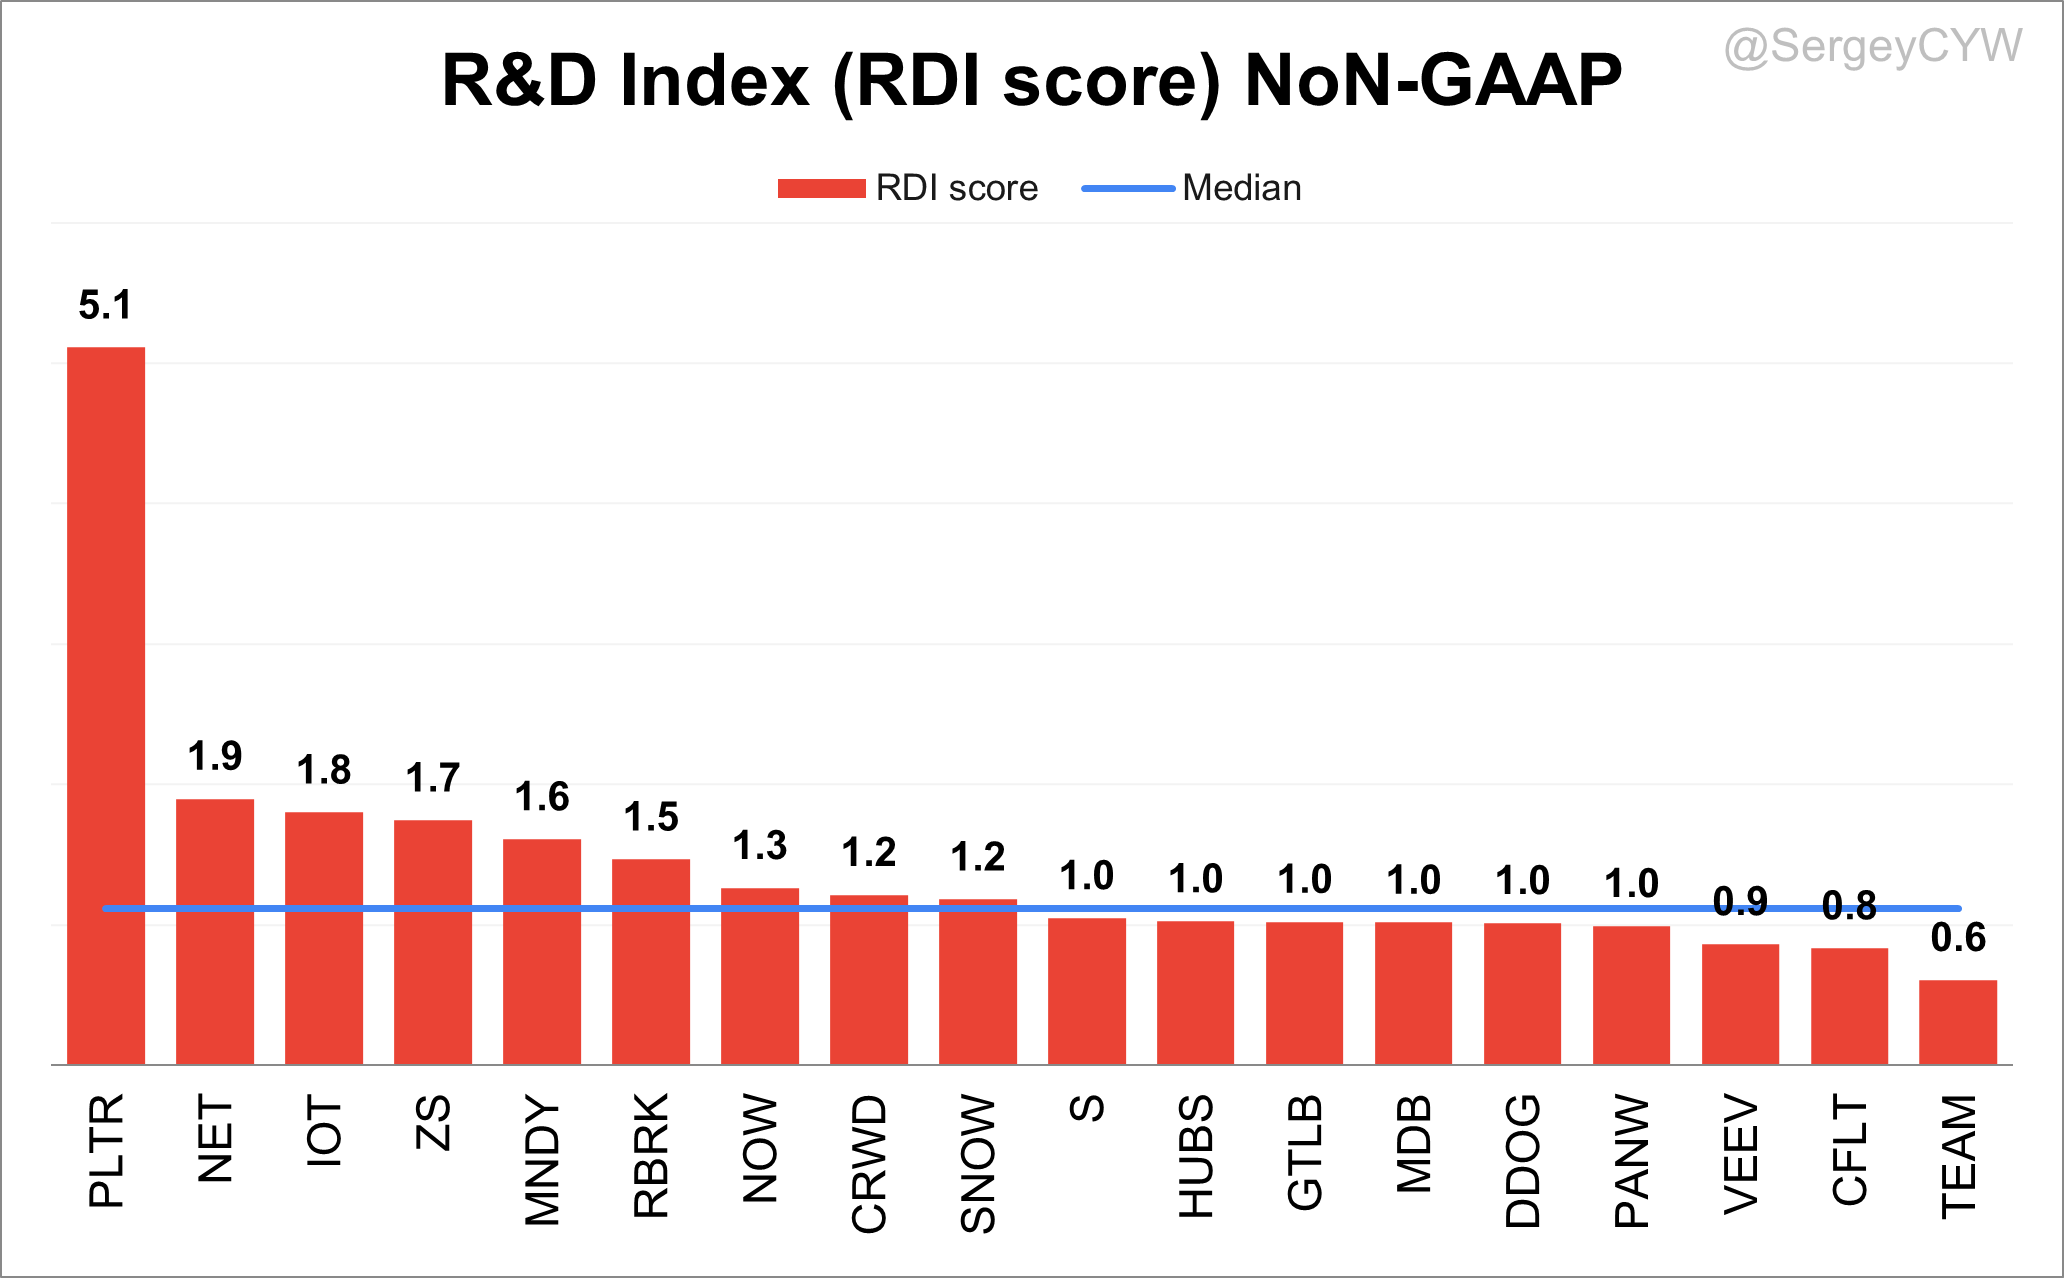
The R&D Index (RDI Score) is a key metric that evaluates how efficiently SaaS companies convert their R&D investments into organic revenue growth. In a competitive landscape, innovation drives customer satisfaction, retention, and long-term expansion. Companies with higher RDI scores consistently outperform peers, delivering stronger total shareholder returns (TSR).
An RDI Score above 1.4 means a company generates more than $1.40 in revenue for every $1 spent on R&D—a hallmark of best-in-class performance. For context, the industry median is around 0.7, but among leading SaaS names, this metric often exceeds 1.3, signaling exceptional efficiency and innovation.
In Q3 2025, the top performers by RDI Score were: $PLTR with score at 5.1, $ NET at 1.9, $IOT, and $ZS at 1.8, and $MNDY at 1.6.
The median RDI Score for the SaaS companies I track is 1.1, down from 1.2 in the previous quarter.
At the lower end, $TEAM posted an RDI Score of 0.6, falling at the industry median—indicating less efficient R&D investment compared to peers.
SaaS Magic Number
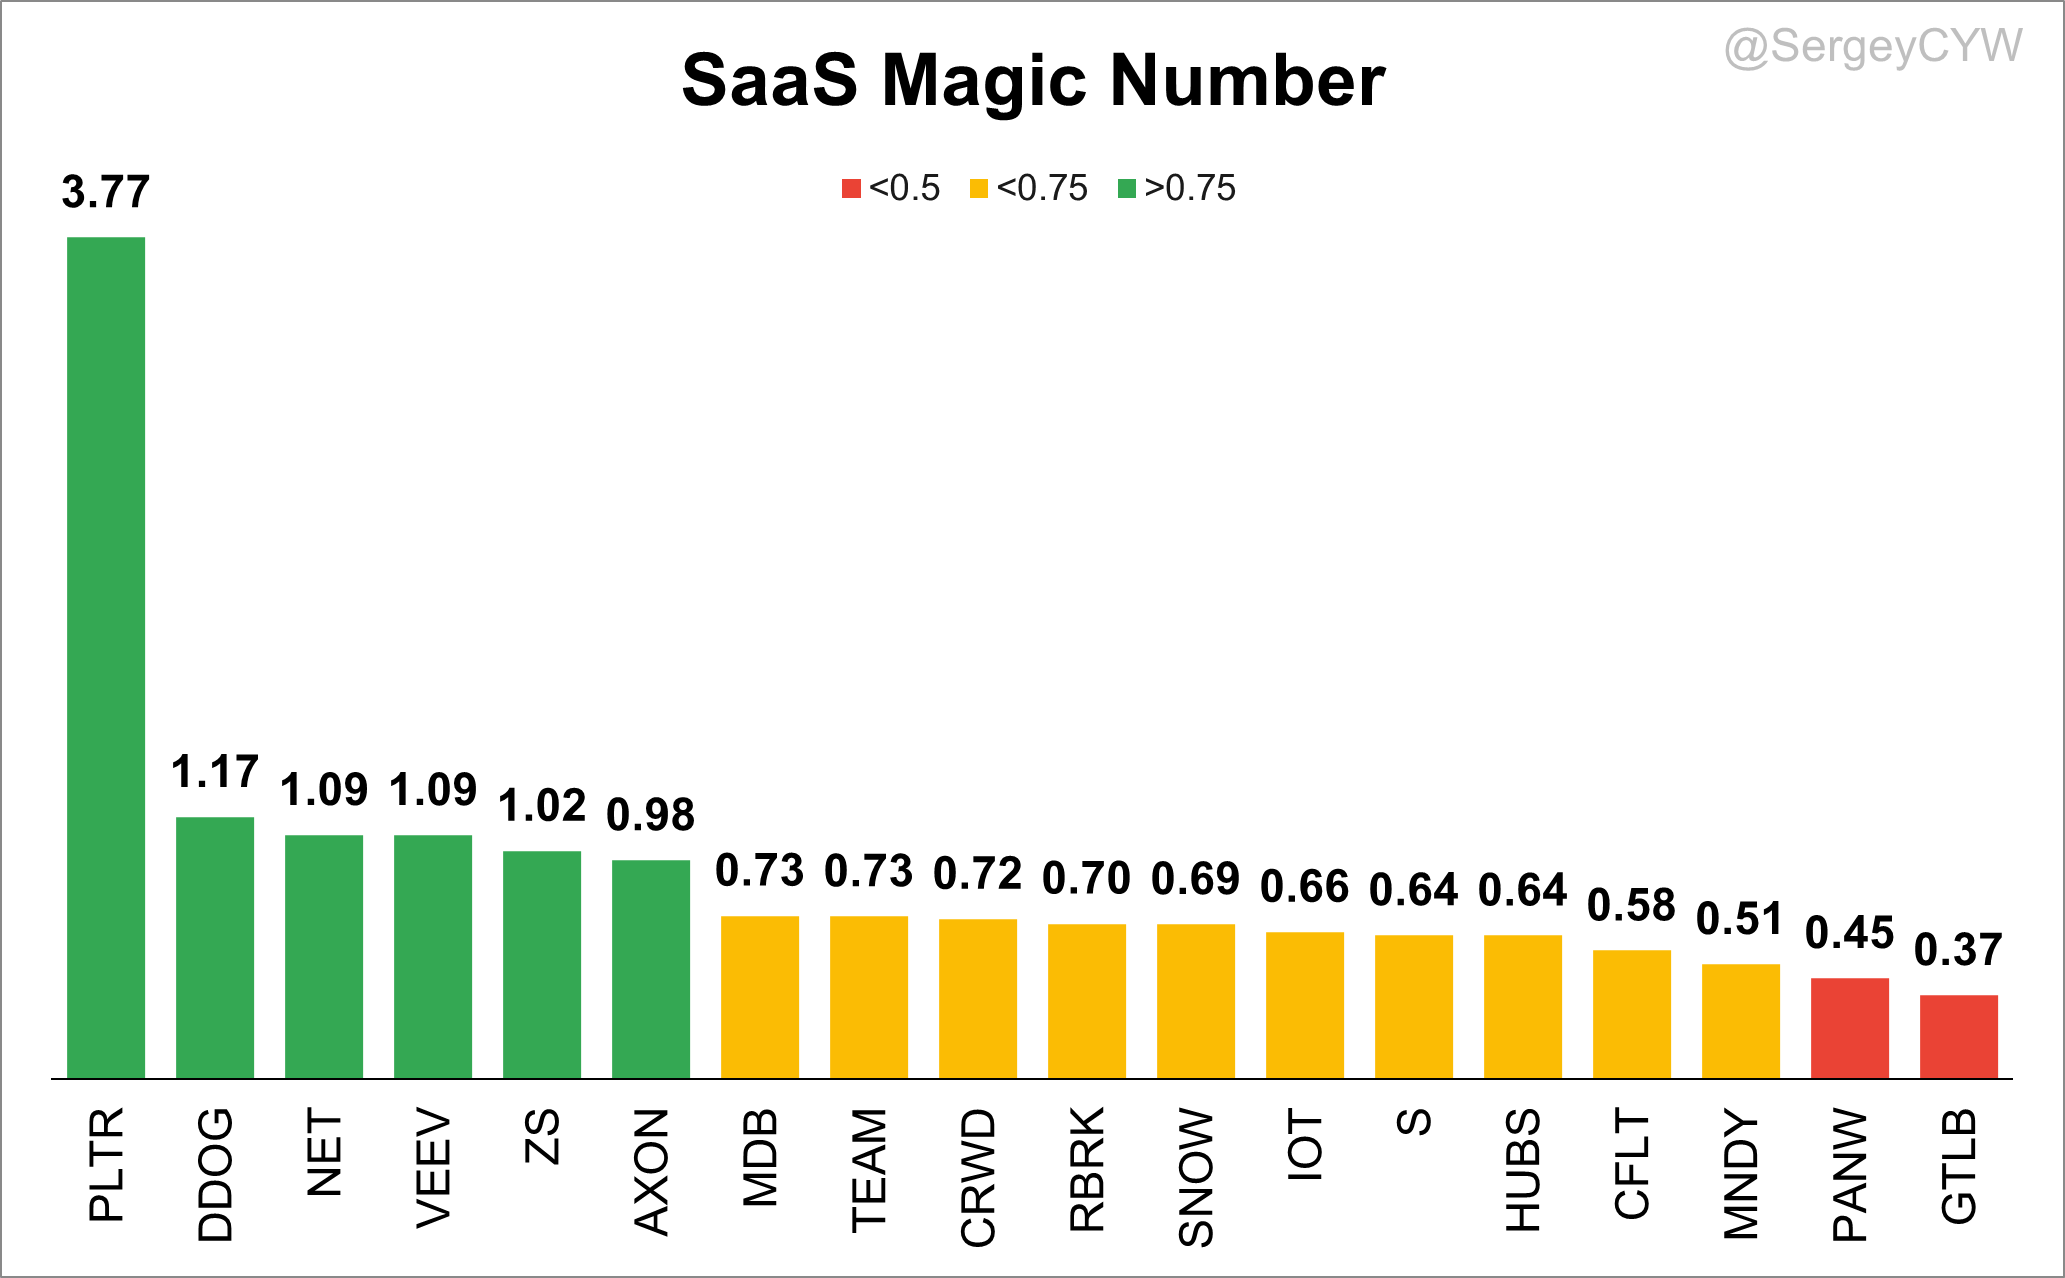
The SaaS Magic Number is a pivotal metric used to evaluate the efficiency of sales and marketing investments within SaaS companies.
It offers investors and managers a clear view of how effectively a company is converting its sales and marketing spend into revenue growth, which is particularly crucial for businesses that follow a subscription-based model.
In the SaaS industry, customer acquisition costs are typically high but lead to prolonged revenue streams.
Interpretation of the SaaS Magic Number
Magic Number > 0.75: Indicates high efficiency in sales and marketing efforts. Companies achieving this level are generally considered to be effectively utilizing their investments in these areas and may safely increase spending to drive growth.
Magic Number between 0.5 and 0.75: Suggests moderate efficiency. Companies in this range are seeing some return on sales and marketing spend but should explore ways to optimize these investments.
Magic Number < 0.5: Reflects poor efficiency. Companies with a magic number below 0.5 may need to reassess their sales strategies or marketing campaigns, as their investments are not translating effectively into revenue growth.
Limitations of the SaaS Magic Number
Seasonality and Sales Cycles: The metric does not account for the effects of seasonality and sales cycles.
Growth Stage Influence: The metric might be misleading for very early-stage companies or those in a rapid expansion phase, where sales and marketing spend is aggressively high.
🟢Magic Number > 0.75: $PLTR, $AXON, $VEEV, $DDOG, $NET, $ZS.
🟠Magic Number > 0.5: $NET, $CRWD, $IOT, $ZS, $HUBS, $MNDY, $S, $TEAM, $CFLT.
🔴Magic Number < 0.5: $GTLB, $PANW.
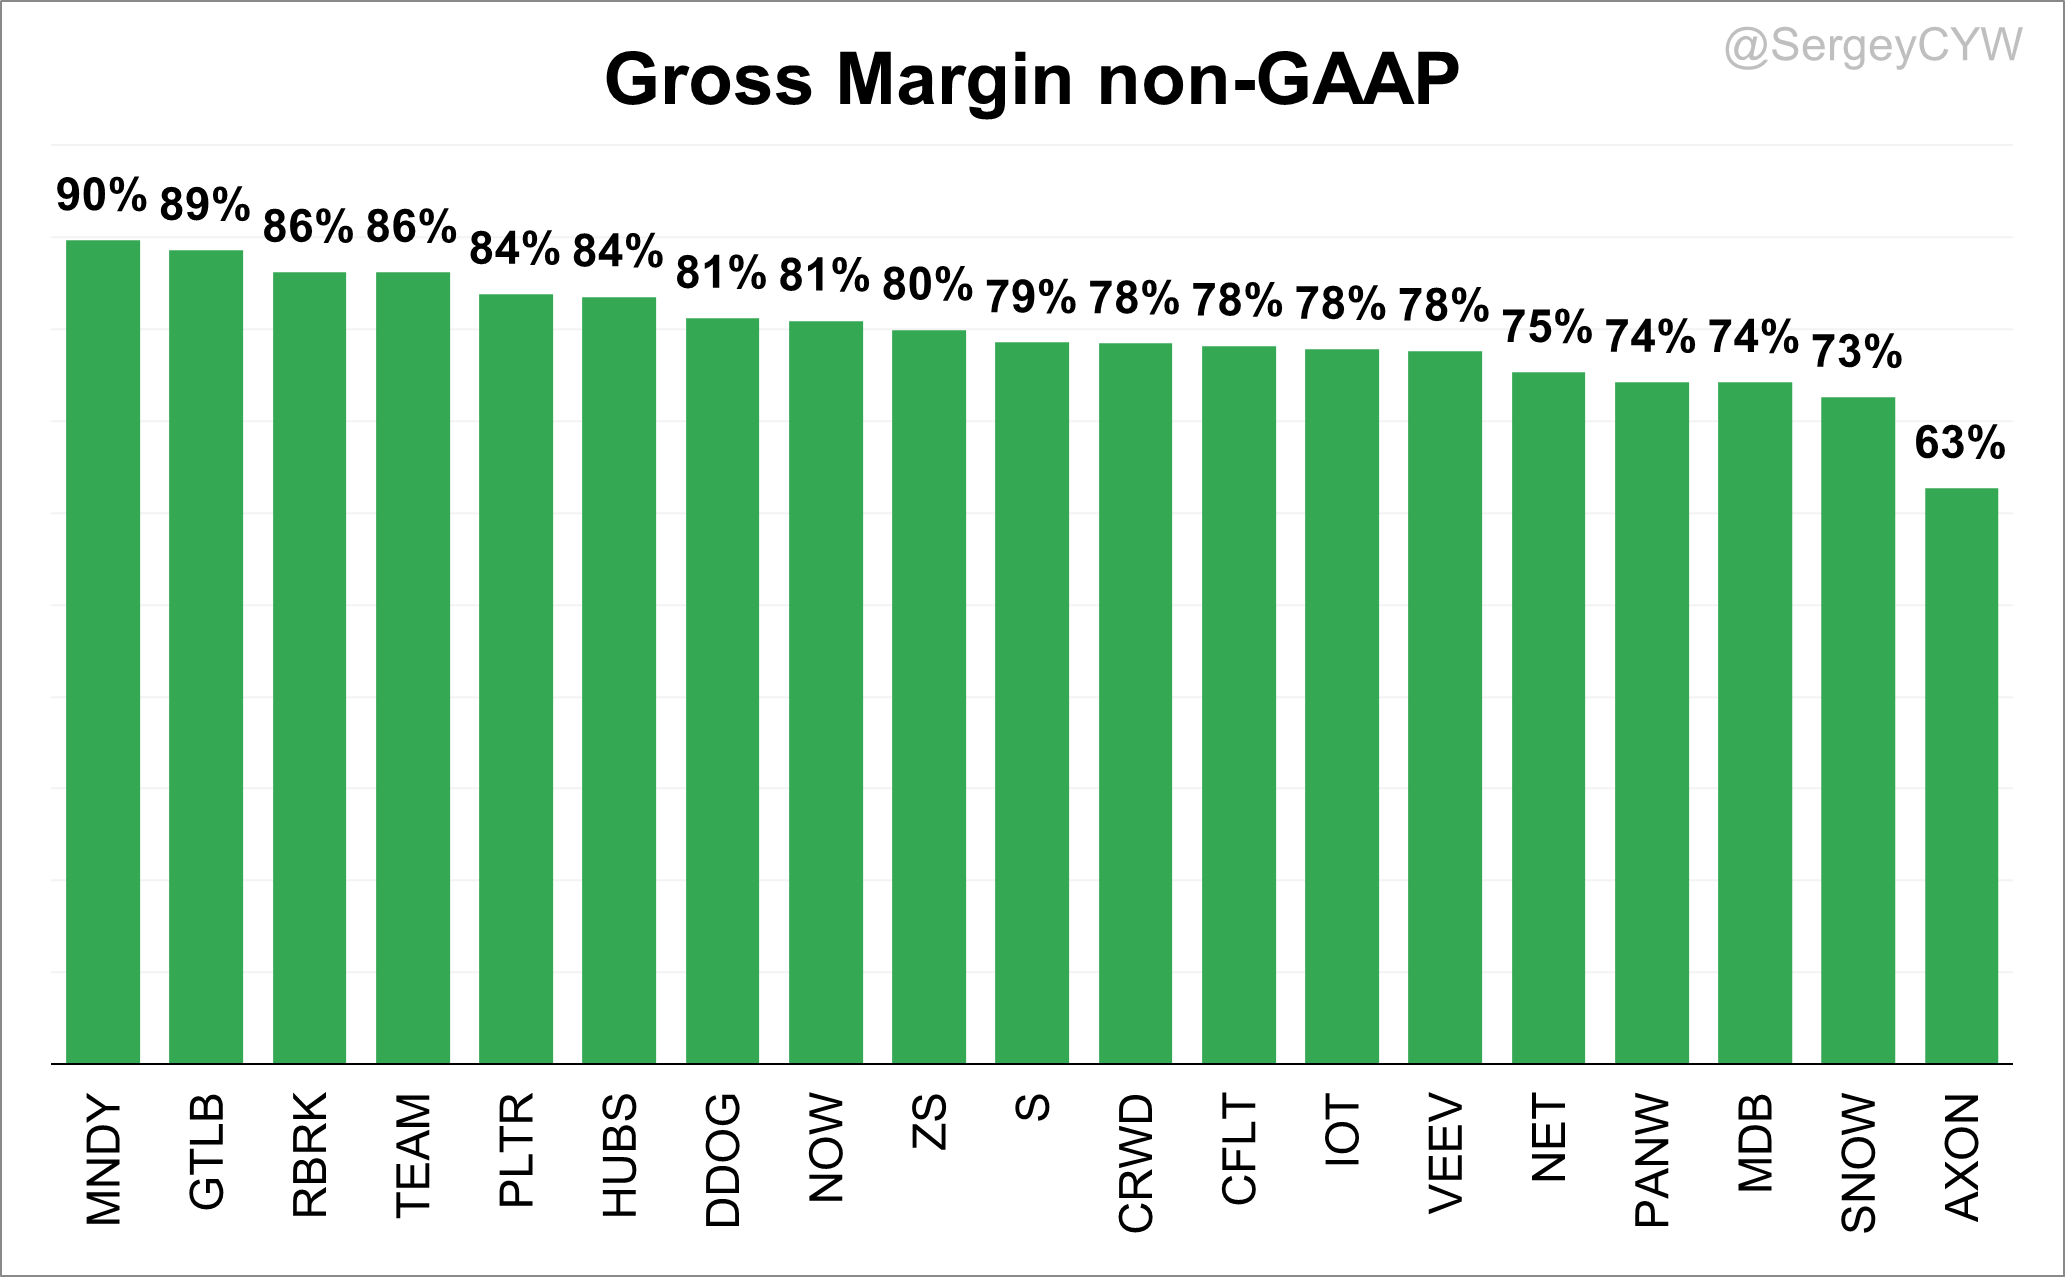
Margins and Profitability
Next, let's discuss margins, starting with Gross Margin non-GAAP. For $AXON, the Gross Margin is 63%, but specifically for Software & Services, it’s 74%. The highest Gross Margins are seen at $MNDY 90% and $GTLB 89%.
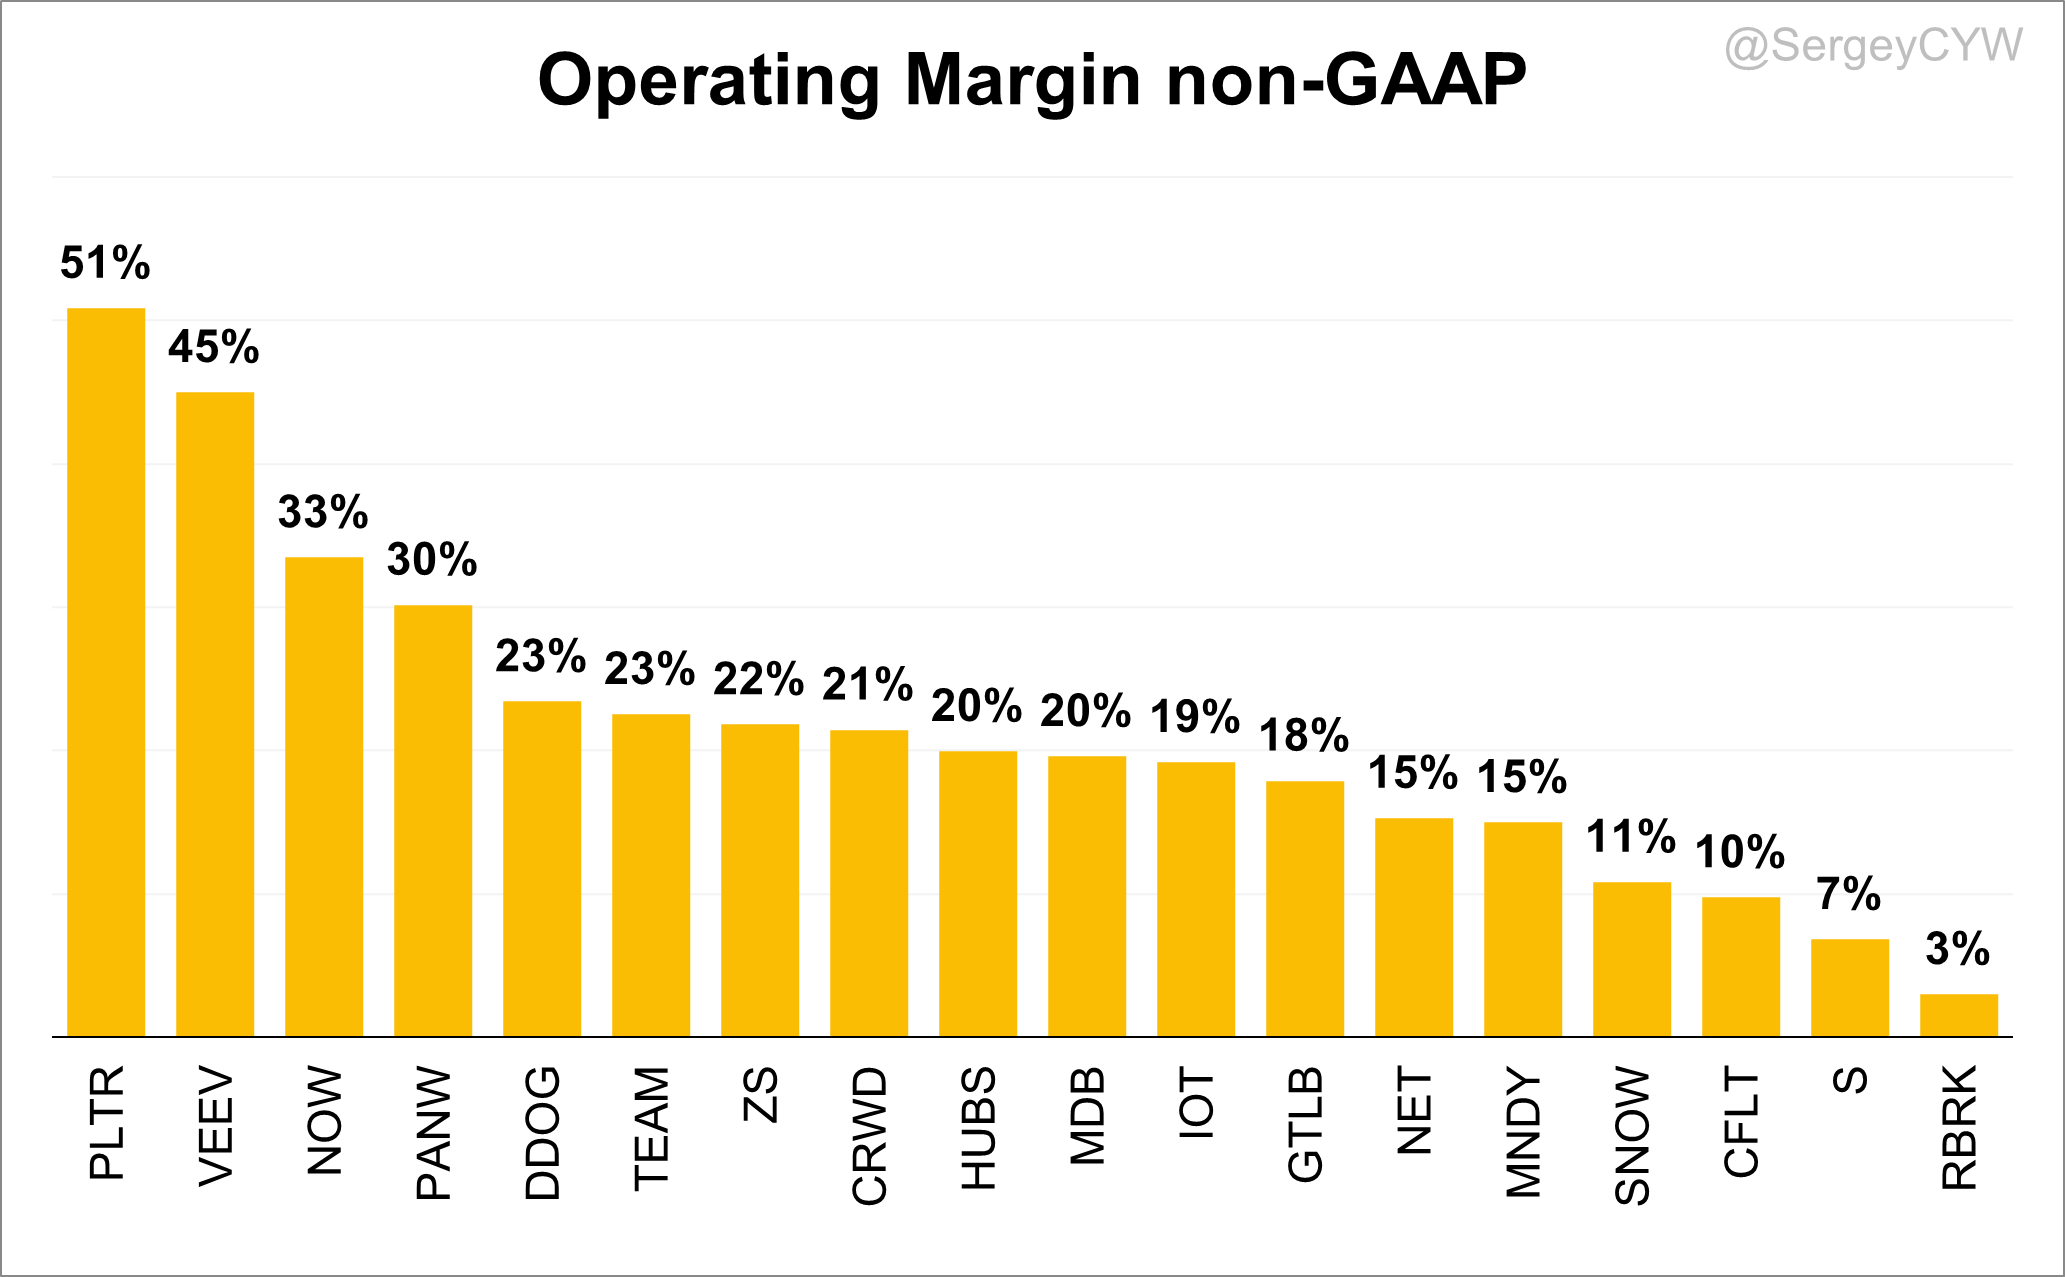
Regarding non-GAAP Operating Margins, the highest performers are $PLTR at 51% and $VEEV at 45%. Next, with strong operating margins, are $PANW, $NOW above 30%.
Companies still in earlier growth stages include $S with 7%, and $RBRK with 3% operating margin.
It’s also worth noting that $IOT recently turned profitable on an operating margin basis in 2023, improving from -9% in Q1 2023 to 19%, showing strong progress toward sustainable profitability.
Similarly, $GTLB shifted to a positive operating margin, improving from -12% in Q1 2023 to 18%, reflecting a meaningful turnaround in operating efficiency.
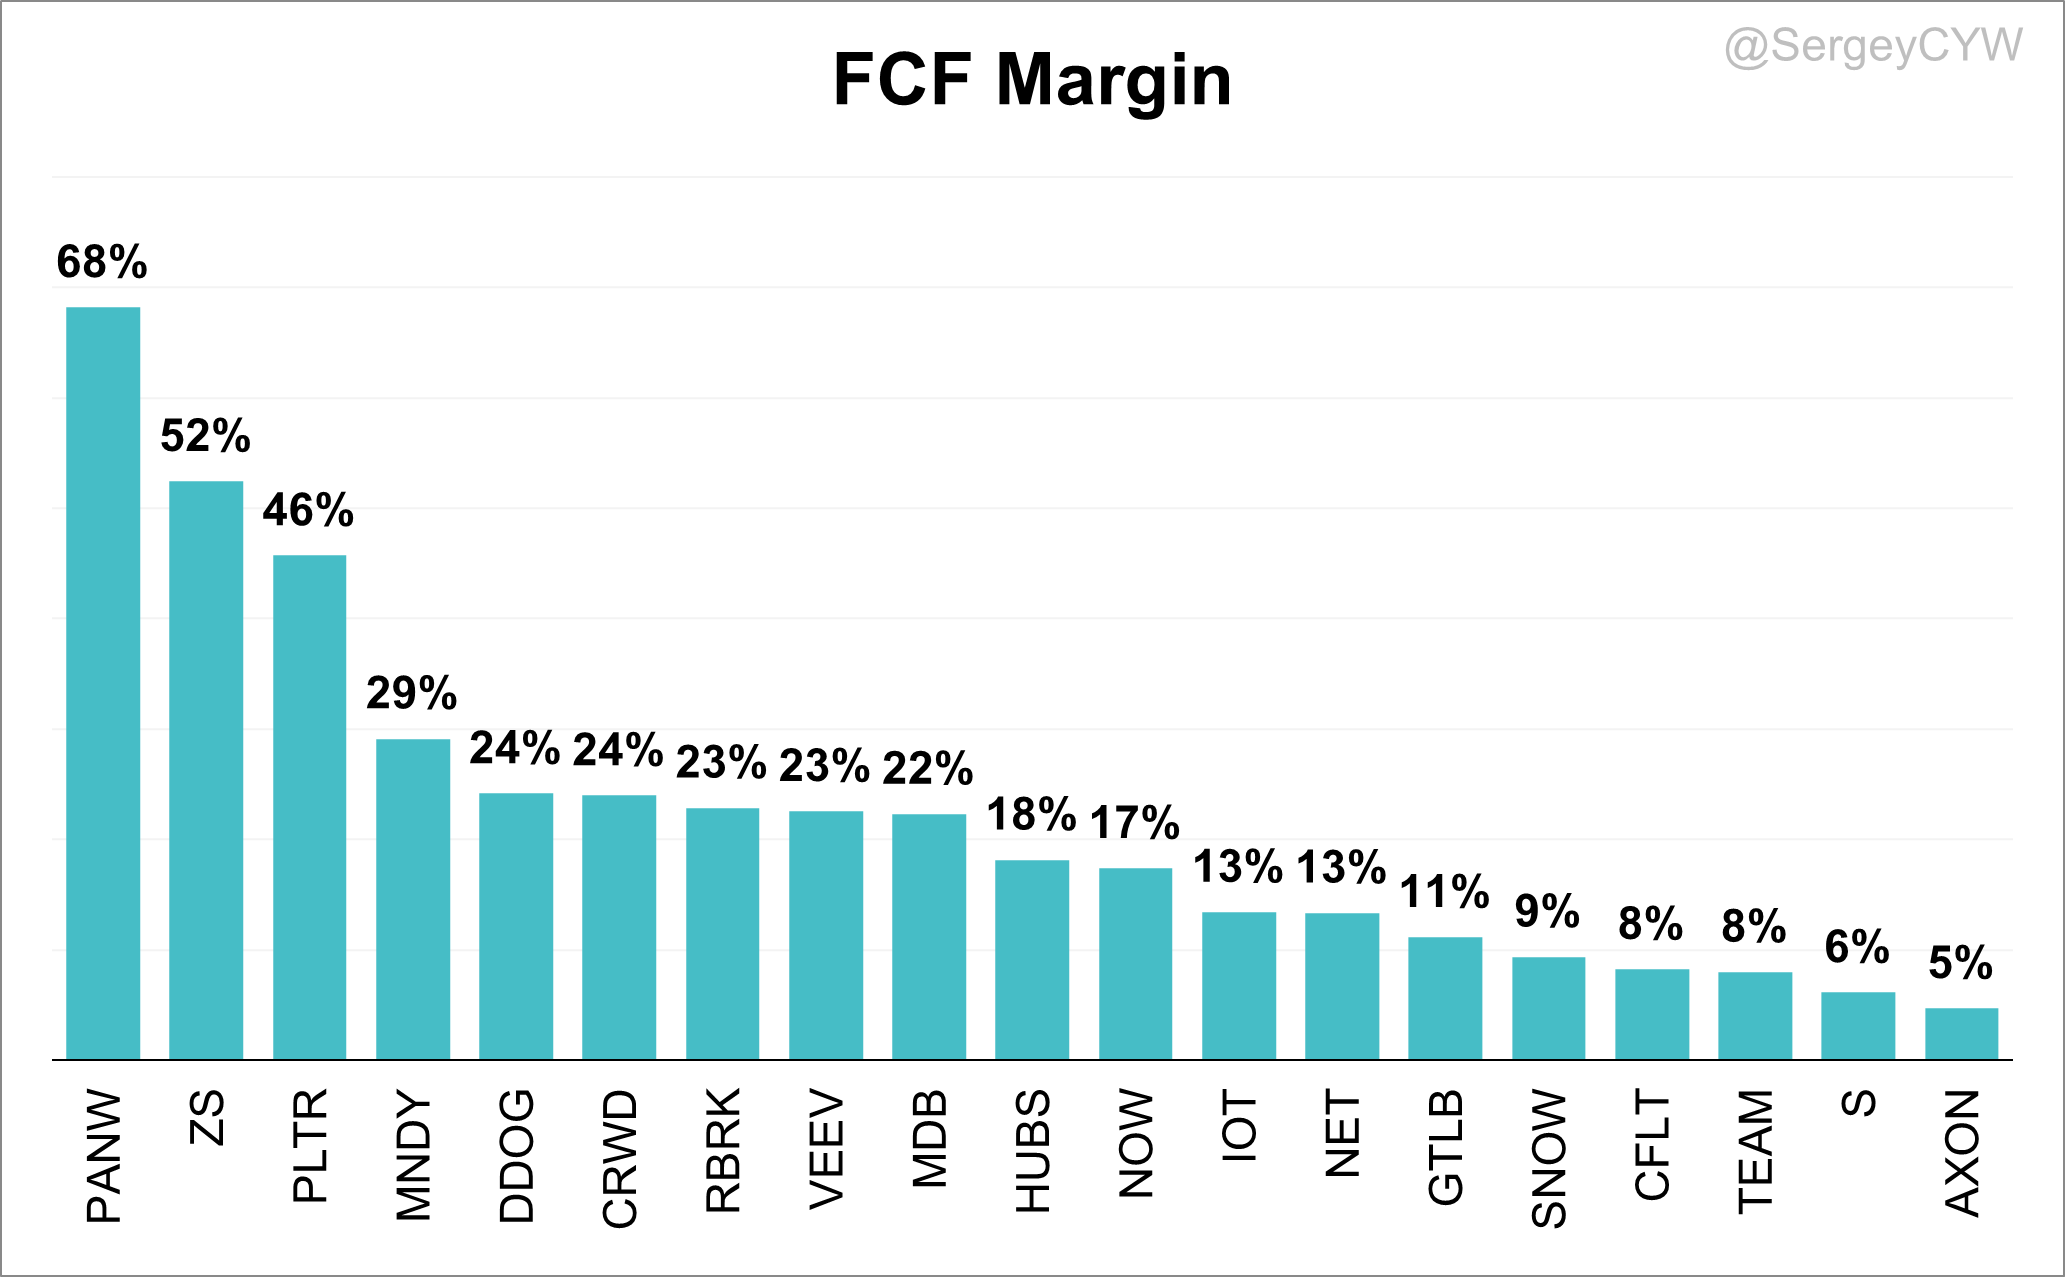
For Q3 2025, the highest Free Cash Flow (FCF) margin was reported by $PANW at 68%, followed by $ZS at 52%, and $PLTR at 46%.
Other strong performers included $CRWD, $MDB, $VEEV, $MNDY, $DDOG and $GTLB, all with FCF margins above 20%.
Notably, $PLTR posted a 46% FCF margin alongside strong revenue growth of +63% YoY.
Stock-Based Compensation and Dilution
Next, let’s examine Stock-Based Compensation (SBC) relative to company revenues.
SBC is a critical tool for SaaS companies—essential for attracting and retaining top talent while aligning employee interests with the long-term success of the business. However, it requires thoughtful management, as excessive SBC can lead to shareholder dilution and negatively impact earnings per share, both of which are key factors for investors assessing a company's financial health and long-term potential.
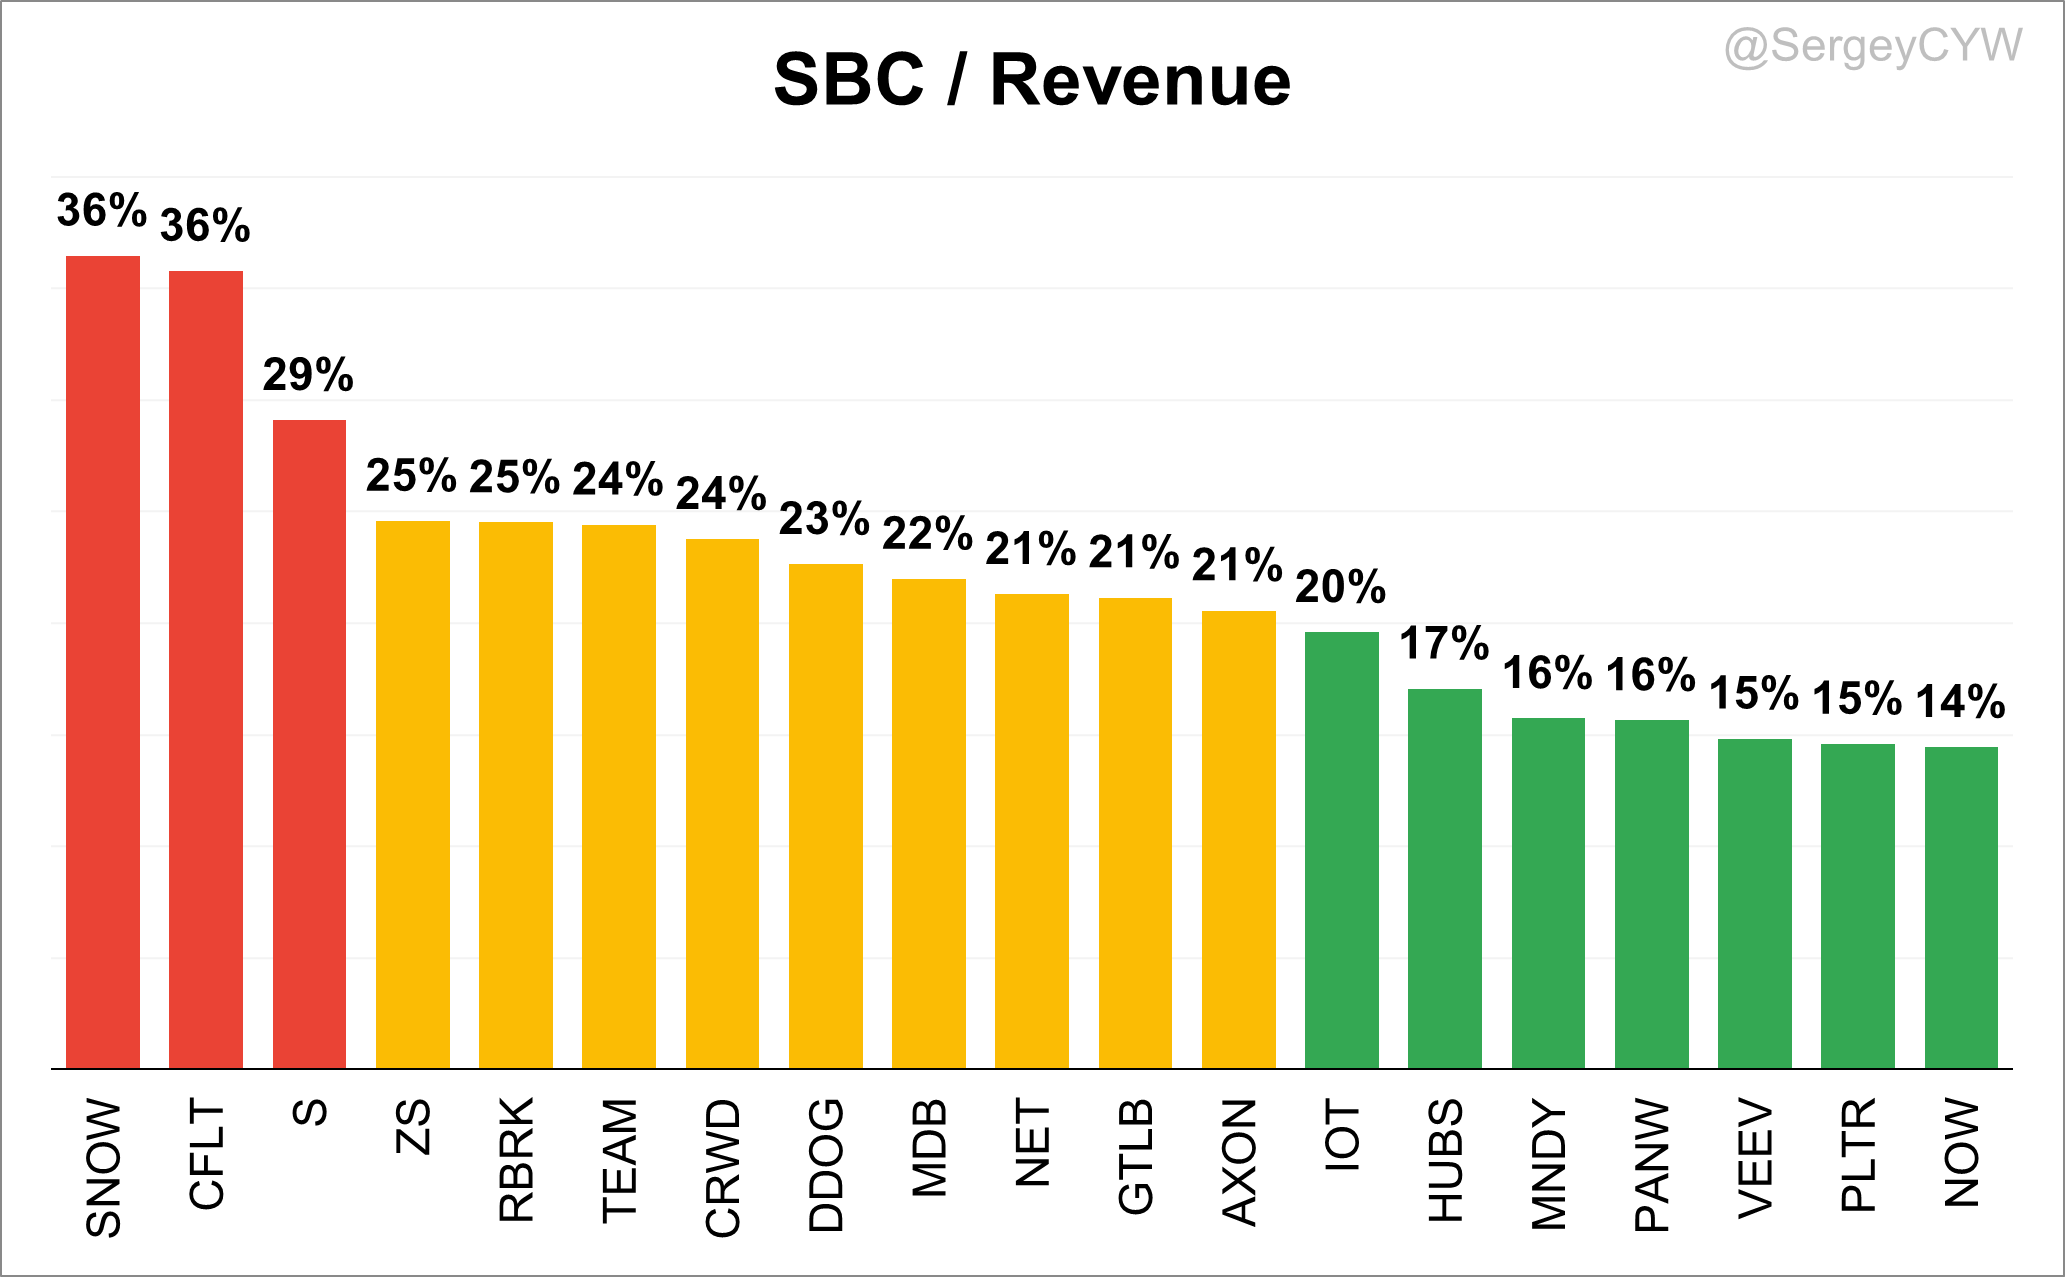
There are significant differences in SBC as a percentage of revenue across the industry.
For example, $SNOW and $CFLT reports one of the highest levels at 36%, followed by $S at 29%. While $SNOW may justify higher SBC through strong revenue growth, $CFLT’s growth sits at 19%, and $S is growing at 23% YoY and continues to decelerate—raising concerns about the sustainability of such high compensation.
Next are $NET, $TEAM, $ZS, $CRWD, $MDB, $GTLB, $DDOG, and $AXON, with elevated SBC levels above 20%.
Other companies such as $IOT, $MNDY, $HUBS, $PLTR, $NOW, $VEEV, and $PANW report SBC levels below 20%, which is more in line with industry norms and suggests a more balanced approach to compensation and growth.
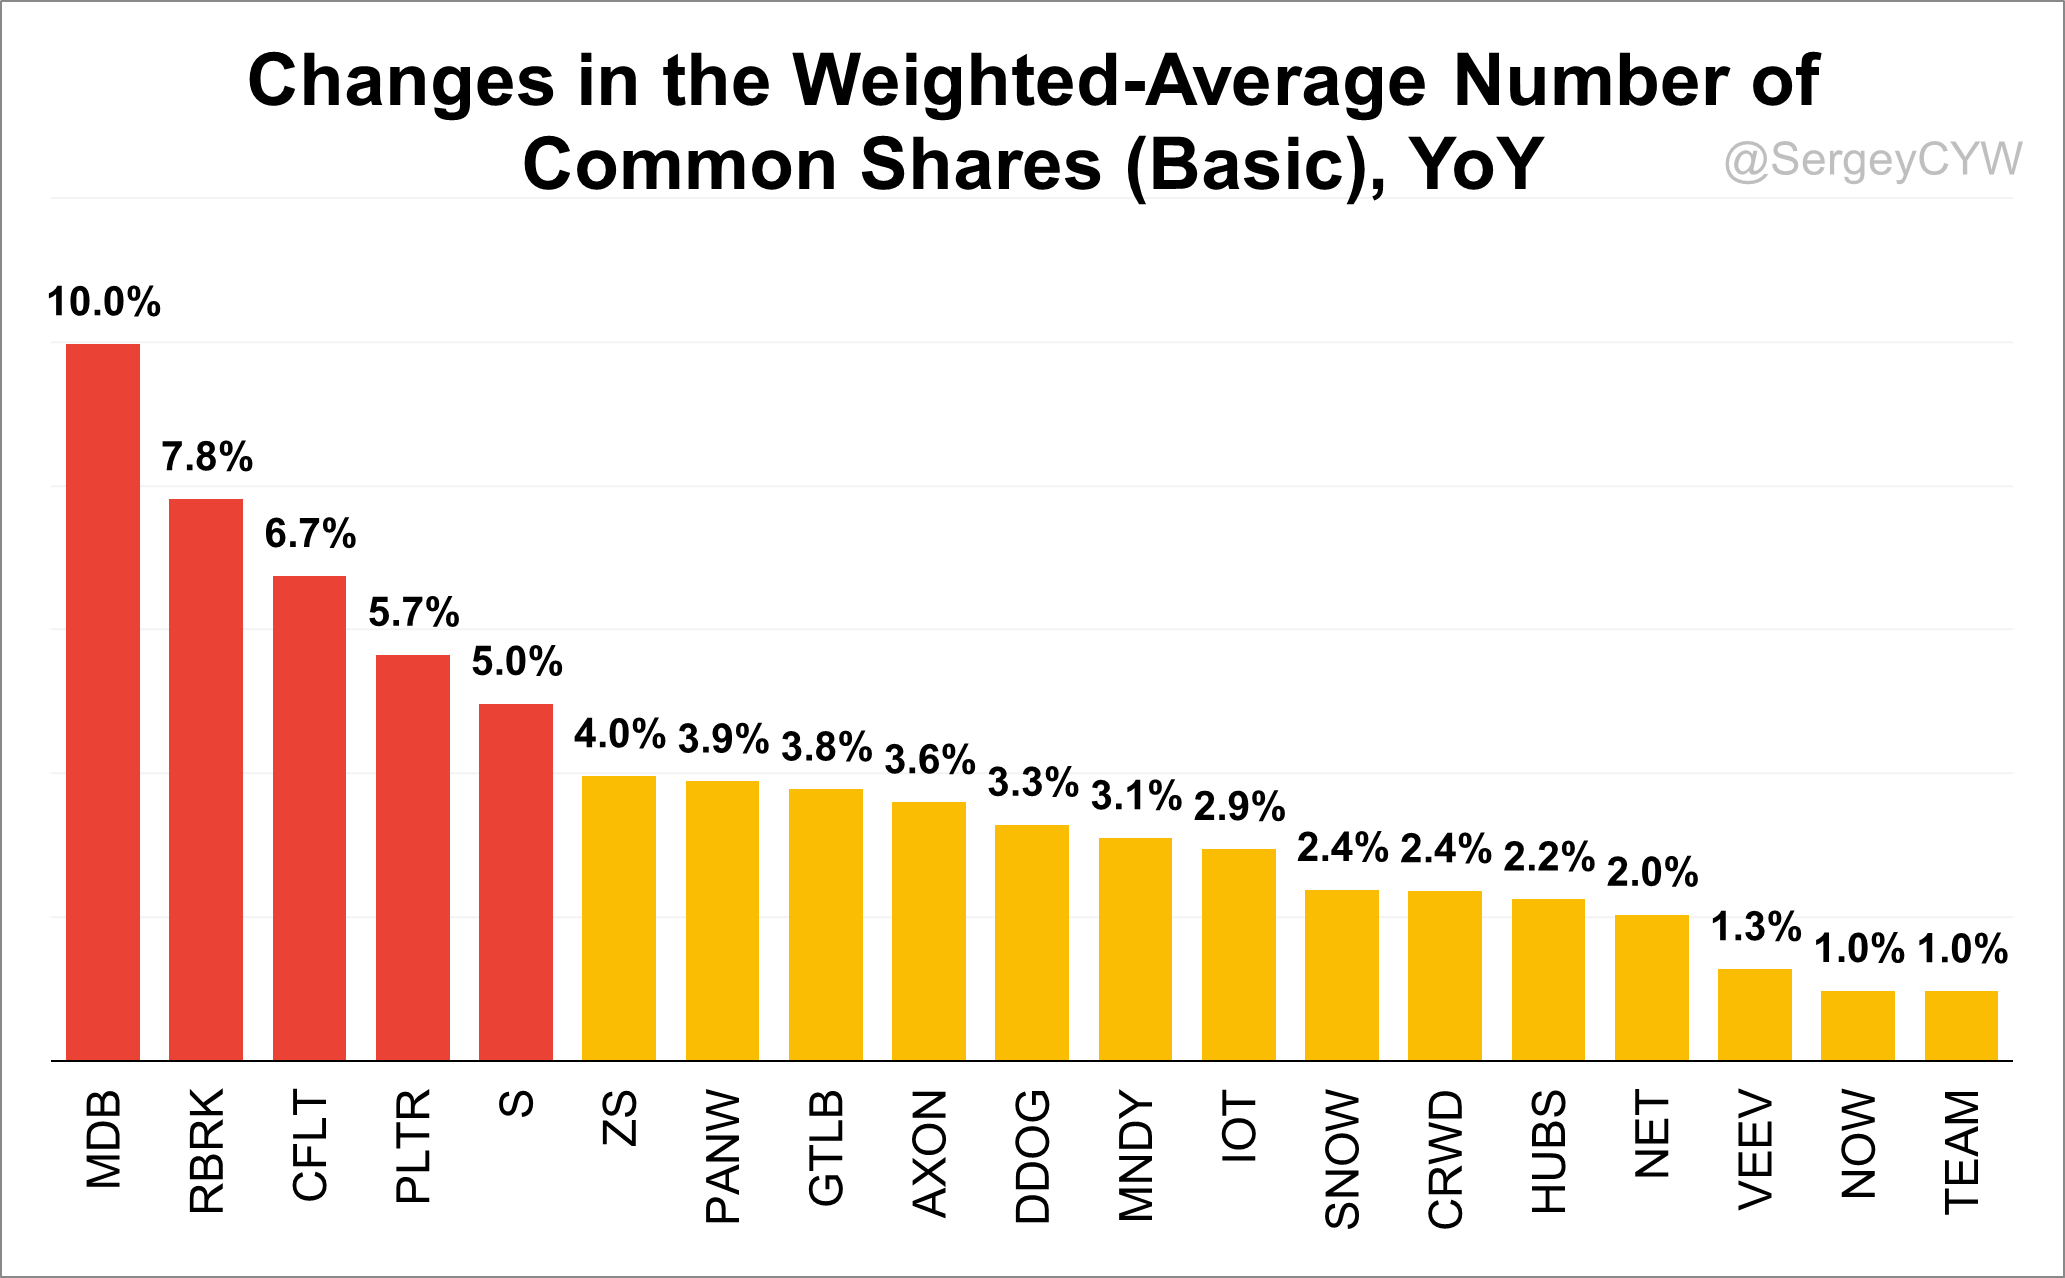
A crucial factor for shareholders is dilution. Let’s examine the changes in the Weighted-Average Number of Common Shares (Basic) over the last quarter.
The most significant dilution occurred at $MDB, with an increase of +10.0%, $RBRK at 7.8%, followed by $CFLT at +6.7%, $PLTR at +5.7%, and $S at +5.0%—a level of dilution that raises serious concerns. Also showing elevated dilution were $ZS, $PANW, $GTLB, $AXON, $DDOG, and $MNDY above +3.0%.
For high-growth companies, more reasonable levels of dilution were observed at $IOT, $SNOW, $CRWD, $HUBS, and $NET, all ranging from 3.0% to 2.0%.
Companies that have kept dilution well under control include $VEEV at 1.3%, $NOW, and $TEAM at 1.0%.
Valuations: Price/Gross Profit, Rule of 40, and PSG
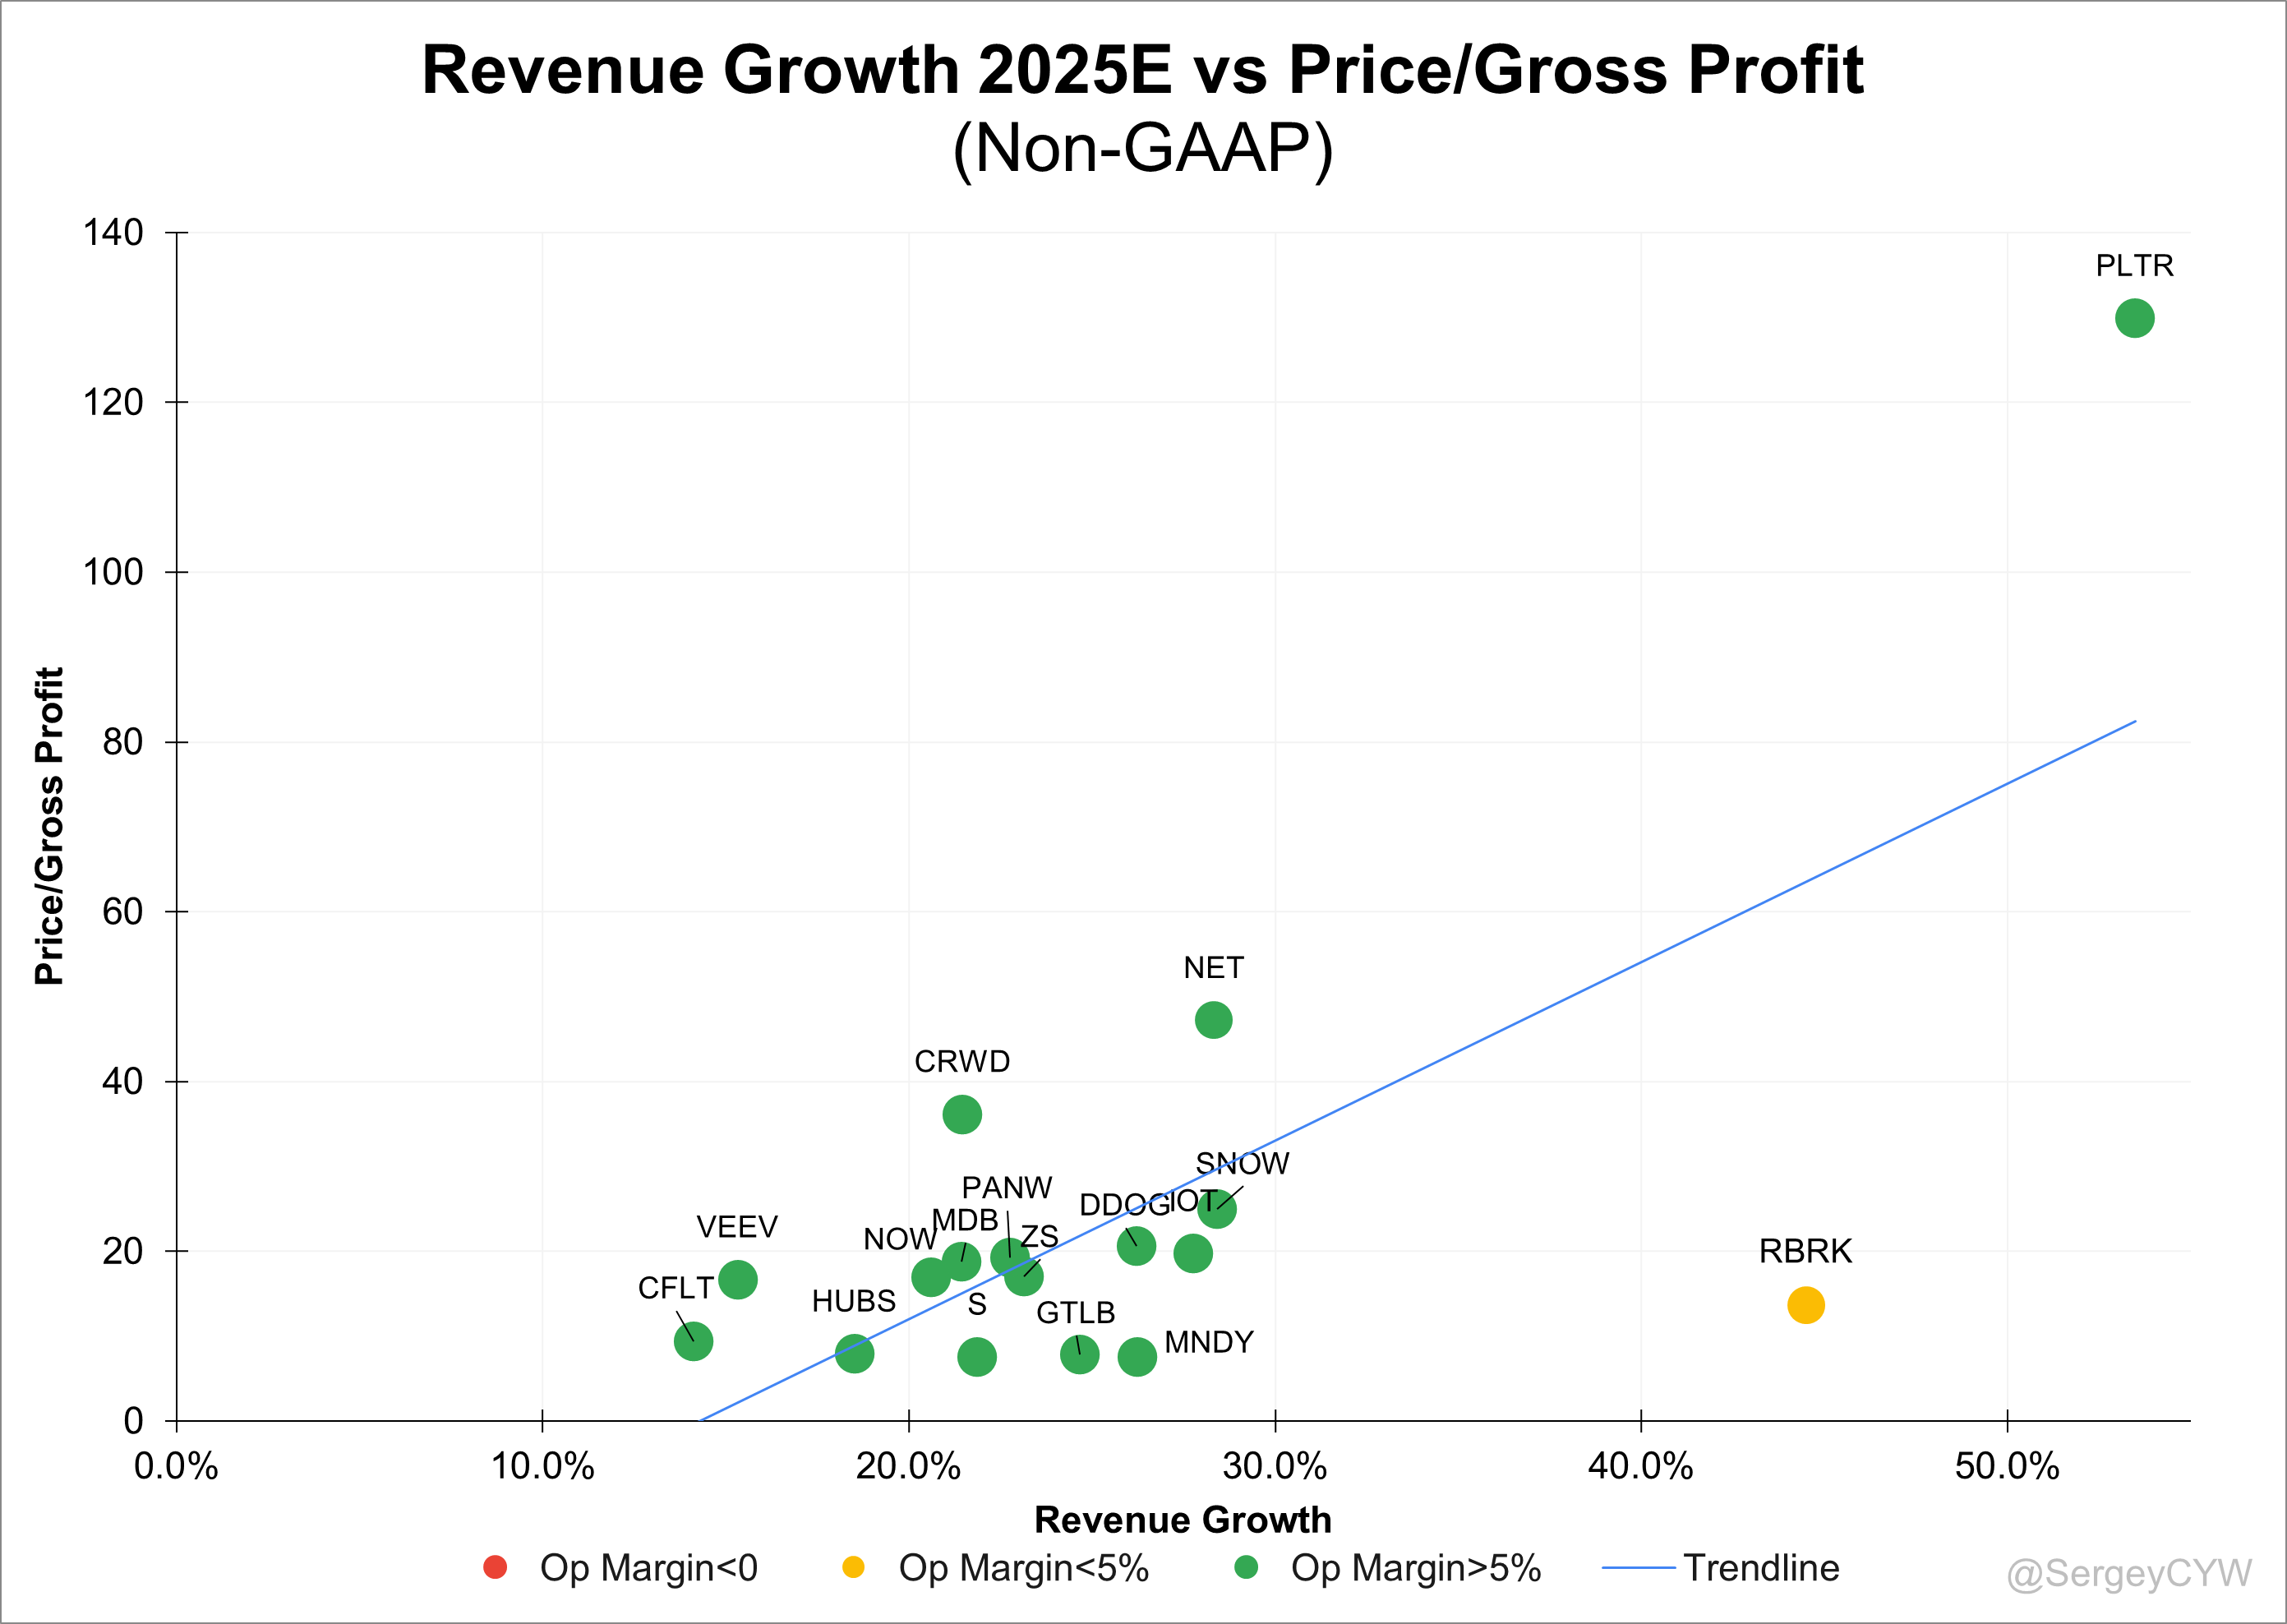
Finally, let’s examine company valuations by analyzing the Price/Gross Profit (Non-GAAP) multiple relative to projected revenue growth over FY 2025.
This multiple incorporates product efficiency via gross profit margin, which is a key metric for software companies. Consistently high or improving gross margins often indicate a strong competitive position and solid market potential.
In the chart, companies with negative operating margins are marked in red, those with operating margins below 5% are in yellow, and those with operating margins above 5% are shown in green.
$PLTR trades at the highest premium, while $NET and $CRWD also trade at a premium, though to a lesser extent.
$RBRK and $MNDY appears undervalued.
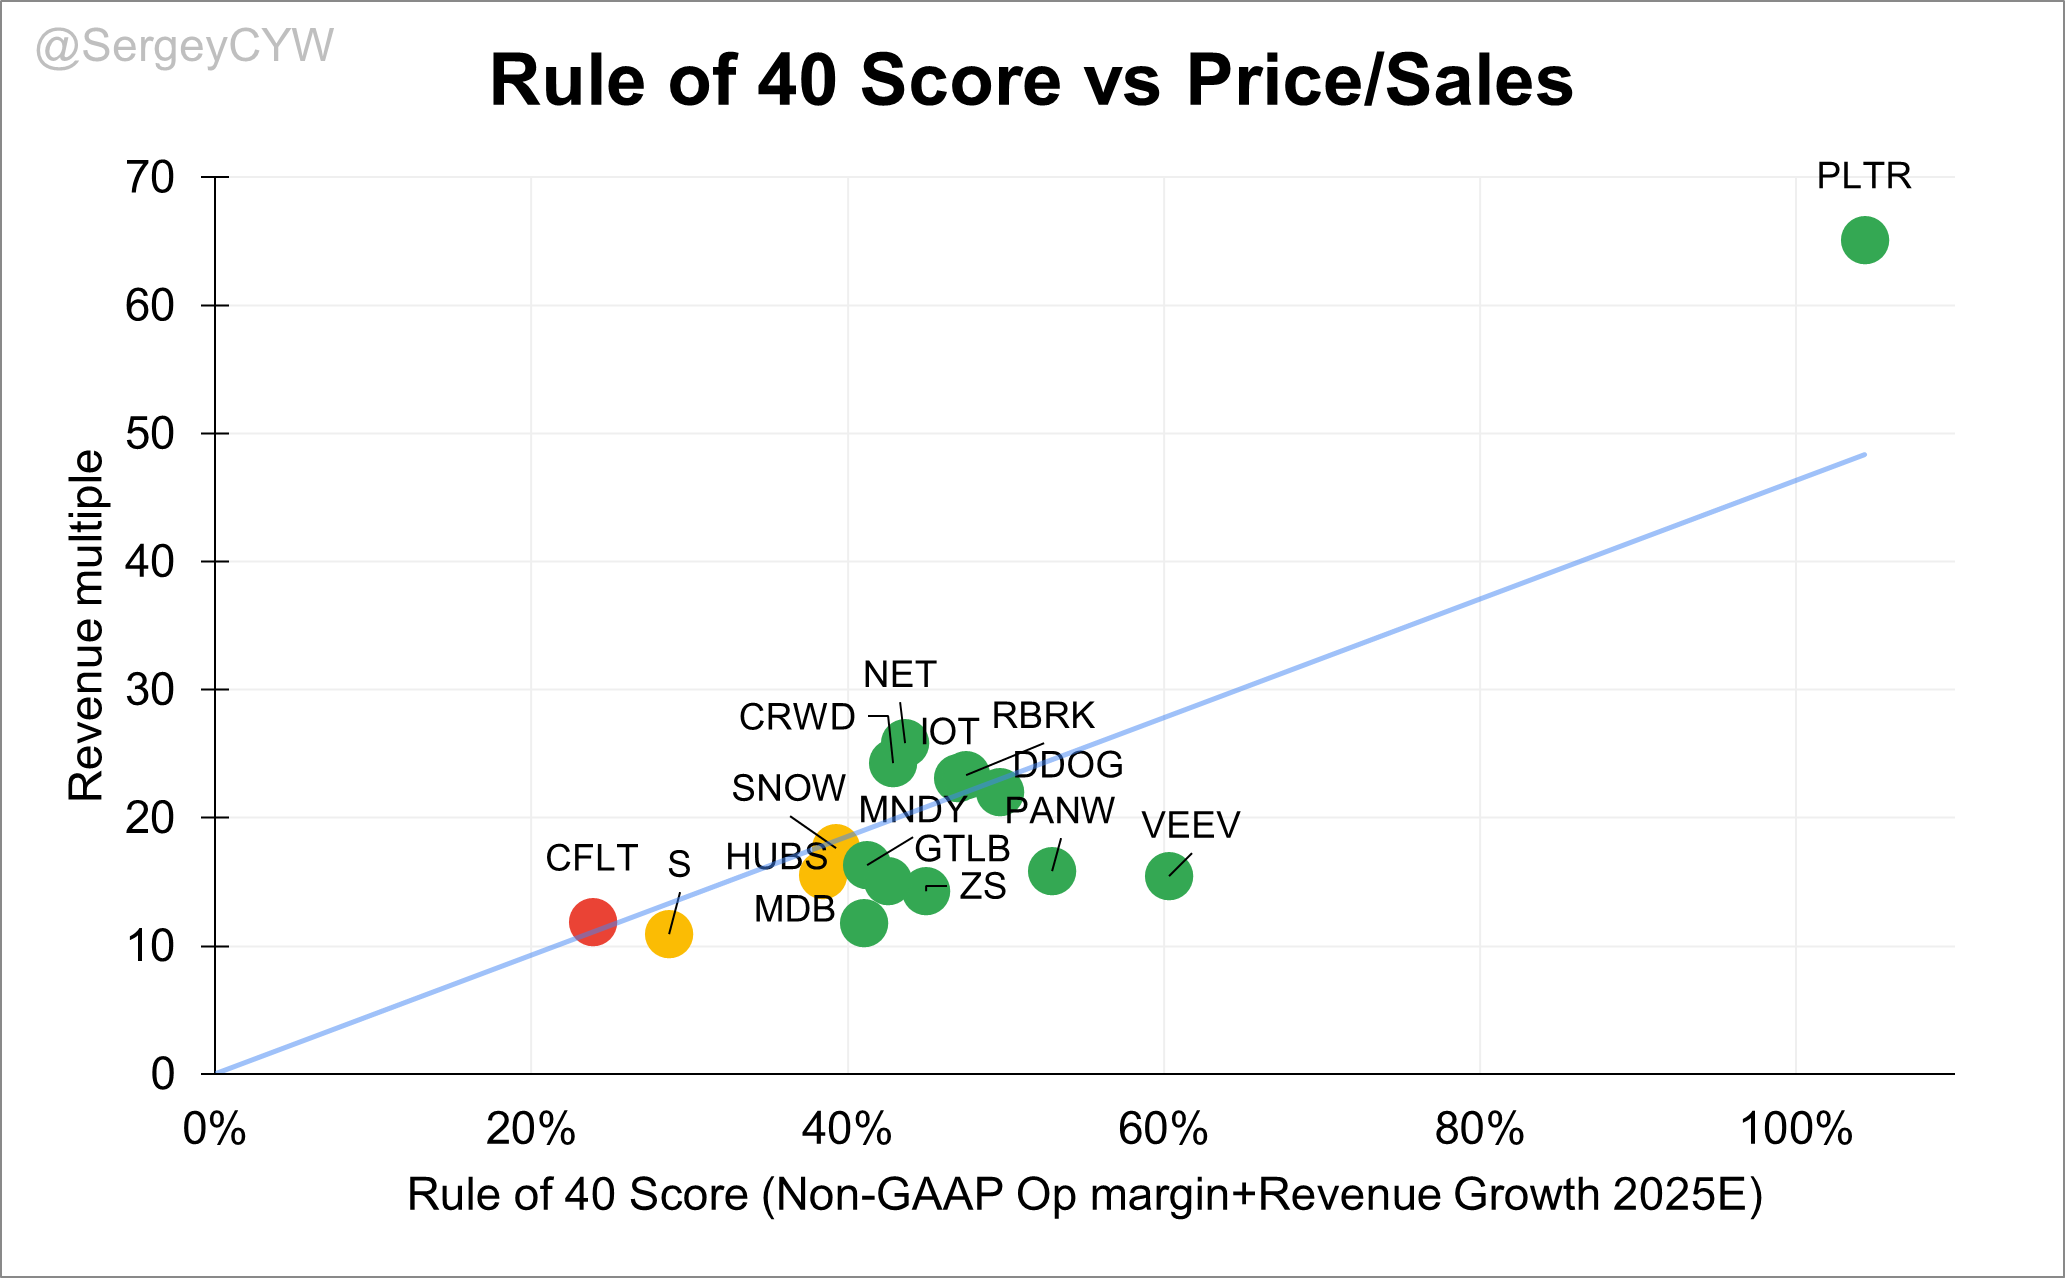
Let’s consider the Rule of 40 as a framework for evaluating companies. The Rule of 40 is a key financial metric used to assess the performance of SaaS and other growth-oriented software companies. It balances revenue growth and profitability, offering a more holistic view of a company’s financial health. Companies that meet or exceed the 40% threshold are generally considered well-positioned, making them attractive to investors seeking a blend of growth and operating efficiency.
For this analysis, I used the non-GAAP operating margin from the most recent quarter, combined with full-year revenue growth estimates. While using quarterly operating margin can introduce some volatility due to seasonality, it also provides insight into companies that have recently achieved operating profitability.
The Rule of 40 is particularly useful for comparing companies across different growth stages and scales.
🟢 Rule of 40 Score > 40: $MDB, $MNDY, $IOT, $NET, $DDOG, $VEEV, $ZS, $PANW, $PLTR
🟠 Rule of 40 Score < 40: $SNOW, $HUBS, $S
🔴 Rule of 40 Score < 25: $CFLT
When comparing Rule of 40 to Price/Sales (P/S) ratios, $PLTR appears overvalued, while $PANW, $ZS, $MDB, and $VEEV appear undervalued based on this metric.
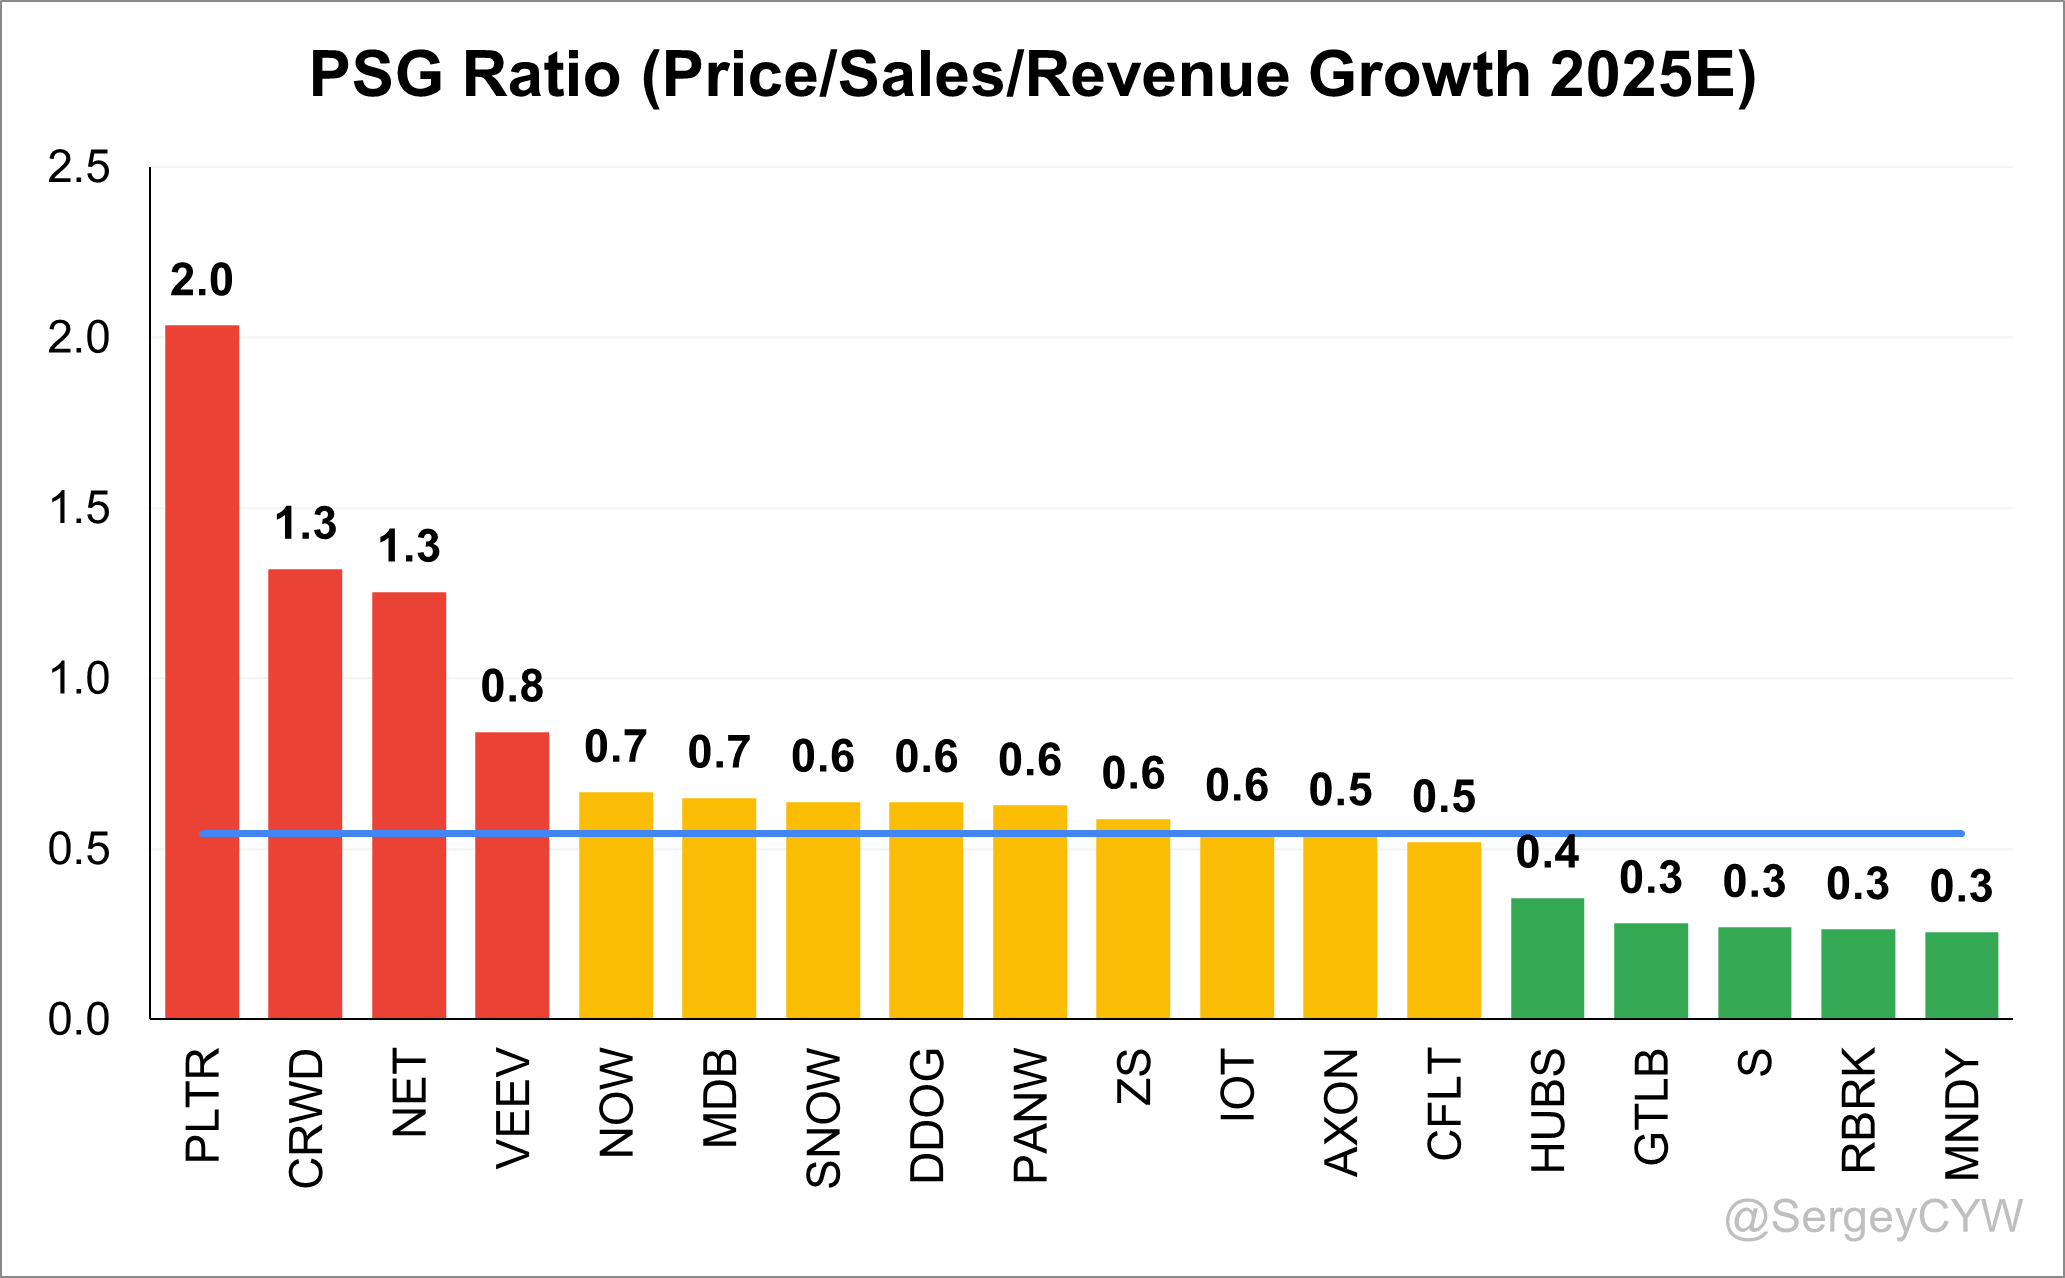
In conclusion, let’s consider the PSG (Price/Sales/Growth) metric. The PSG metric is a valuable valuation tool for evaluating software companies, as it offers a more nuanced perspective than the traditional Price-to-Sales (P/S) ratio by incorporating the company’s growth rate.
This metric is particularly relevant in the software industry, where companies often trade at high P/S multiples driven by expectations of rapid, scalable growth.
The PSG ratio helps determine whether a high P/S valuation is justified based on a company’s actual growth trajectory.
Companies trading with a PSG ratio below the median include $HUBS, $GTLB, $S, $RBRK, $MNDY.
Companies trading around the median PSG level include $IOT, $AXON, $PANW, $ZS, $DDOG, $SNOW, $MDB, and $CFLT.
Companies trading with a PSG ratio above the median include $PLTR, $CRWD, $VEEV, and $NET.
Closing Thoughts
In sum, the Q3 2025 SaaS landscape paints a picture of divergent maturity. A select few—led by Palantir, Datadog, and Veeva—are proving that profitability and growth can coexist. Others are testing investor patience with dilution and slower efficiency gains. Valuations remain polarized, with PLTR trading at a premium while names like RBRK, MNDY, and VEEV appear undervalued. The takeaway is clear: the market is rewarding efficient growth over raw expansion, and that trend is only accelerating.
Thank you for reading!
Follow me for more frequent updates on X/Twitter and Threads, and on LinkedIn. For visual infographics, check out Instagram, and for portfolio changes, follow me on SavvyTrader.
Disclaimer: This earnings review is for informational purposes only and does not constitute financial, investment, or trading advice.
Super comprehensive breakdown. The DBNRR median creeping from 119% to 120% is actually a pretty encouraging signal for the overall market health. What caught my eye though was MDB's 10% dilution alongside that 6.1% revenue beat, thats a pretty rough tradeoff for shareholders even if top-line looks solid. Makes you wonder at what point growth stops justifiying those share count expansions.