
Q1 2026 SaaS Performance
Q1 2026 SaaS Deep Dive: Revenue Beats, DBNRR, CAC Payback, RDI Score, Margins, Valuation, SBC/Revenue, and Shareholder Dilution.

SaaS sector still shows solid execution despite concerns around AI disruption. Revenue beats were broad, with PLTR, RBRK, SNOW, IOT, and DDOG leading the group, while several companies also raised annual guidance. Retention remains healthy, with median DBNRR at 118%, and leaders like PLTR, SNOW, and DDOG, improved and remain above 120%, signaling strong expansion inside existing customer bases.
Profitability also continues to improve. PLTR, VEEV, NOW, and IOT stand out across operating margin, free cash flow, and operating leverage. At the same time, valuation dispersion is large: PLTR, NET, and CRWD trade at premium multiples, while ZS, MNDY, HUBS, and AXON look more attractive across several growth-adjusted frameworks.
The key risk remains quality of growth. Is rising CAC payback, elevated SBC, and dilution in some names a temporary cost of growth — or an early sign of weaker SaaS economics? Let’s dig deeper.
Table of Contents
Revenue Forecast Outperformance
Changes to Annual Guidance
Dollar-Based Net Retention Rate (DBNRR)
Expense Prioritization: R&D vs. S&M
CAC Payback Period
R&D Index (RDI Score)
SaaS Magic Number
Margins and Profitability
Stock-Based Compensation and Dilution
Valuations: P/S, P/GP, P/OP, Rule of 40, and PSG
Closing Thoughts
Let’s explore the key metrics—Dollar-Based Net Retention Rate (DBNRR), Customer Acquisition Cost (CAC) Payback Period, Gross and Operating Margins, R&D Efficiency, Stock-Based Compensation (SBC), Dilution, and Valuation—that offer a comprehensive view into the underlying business quality and market positioning of these companies.
Revenue Forecast Outperformance
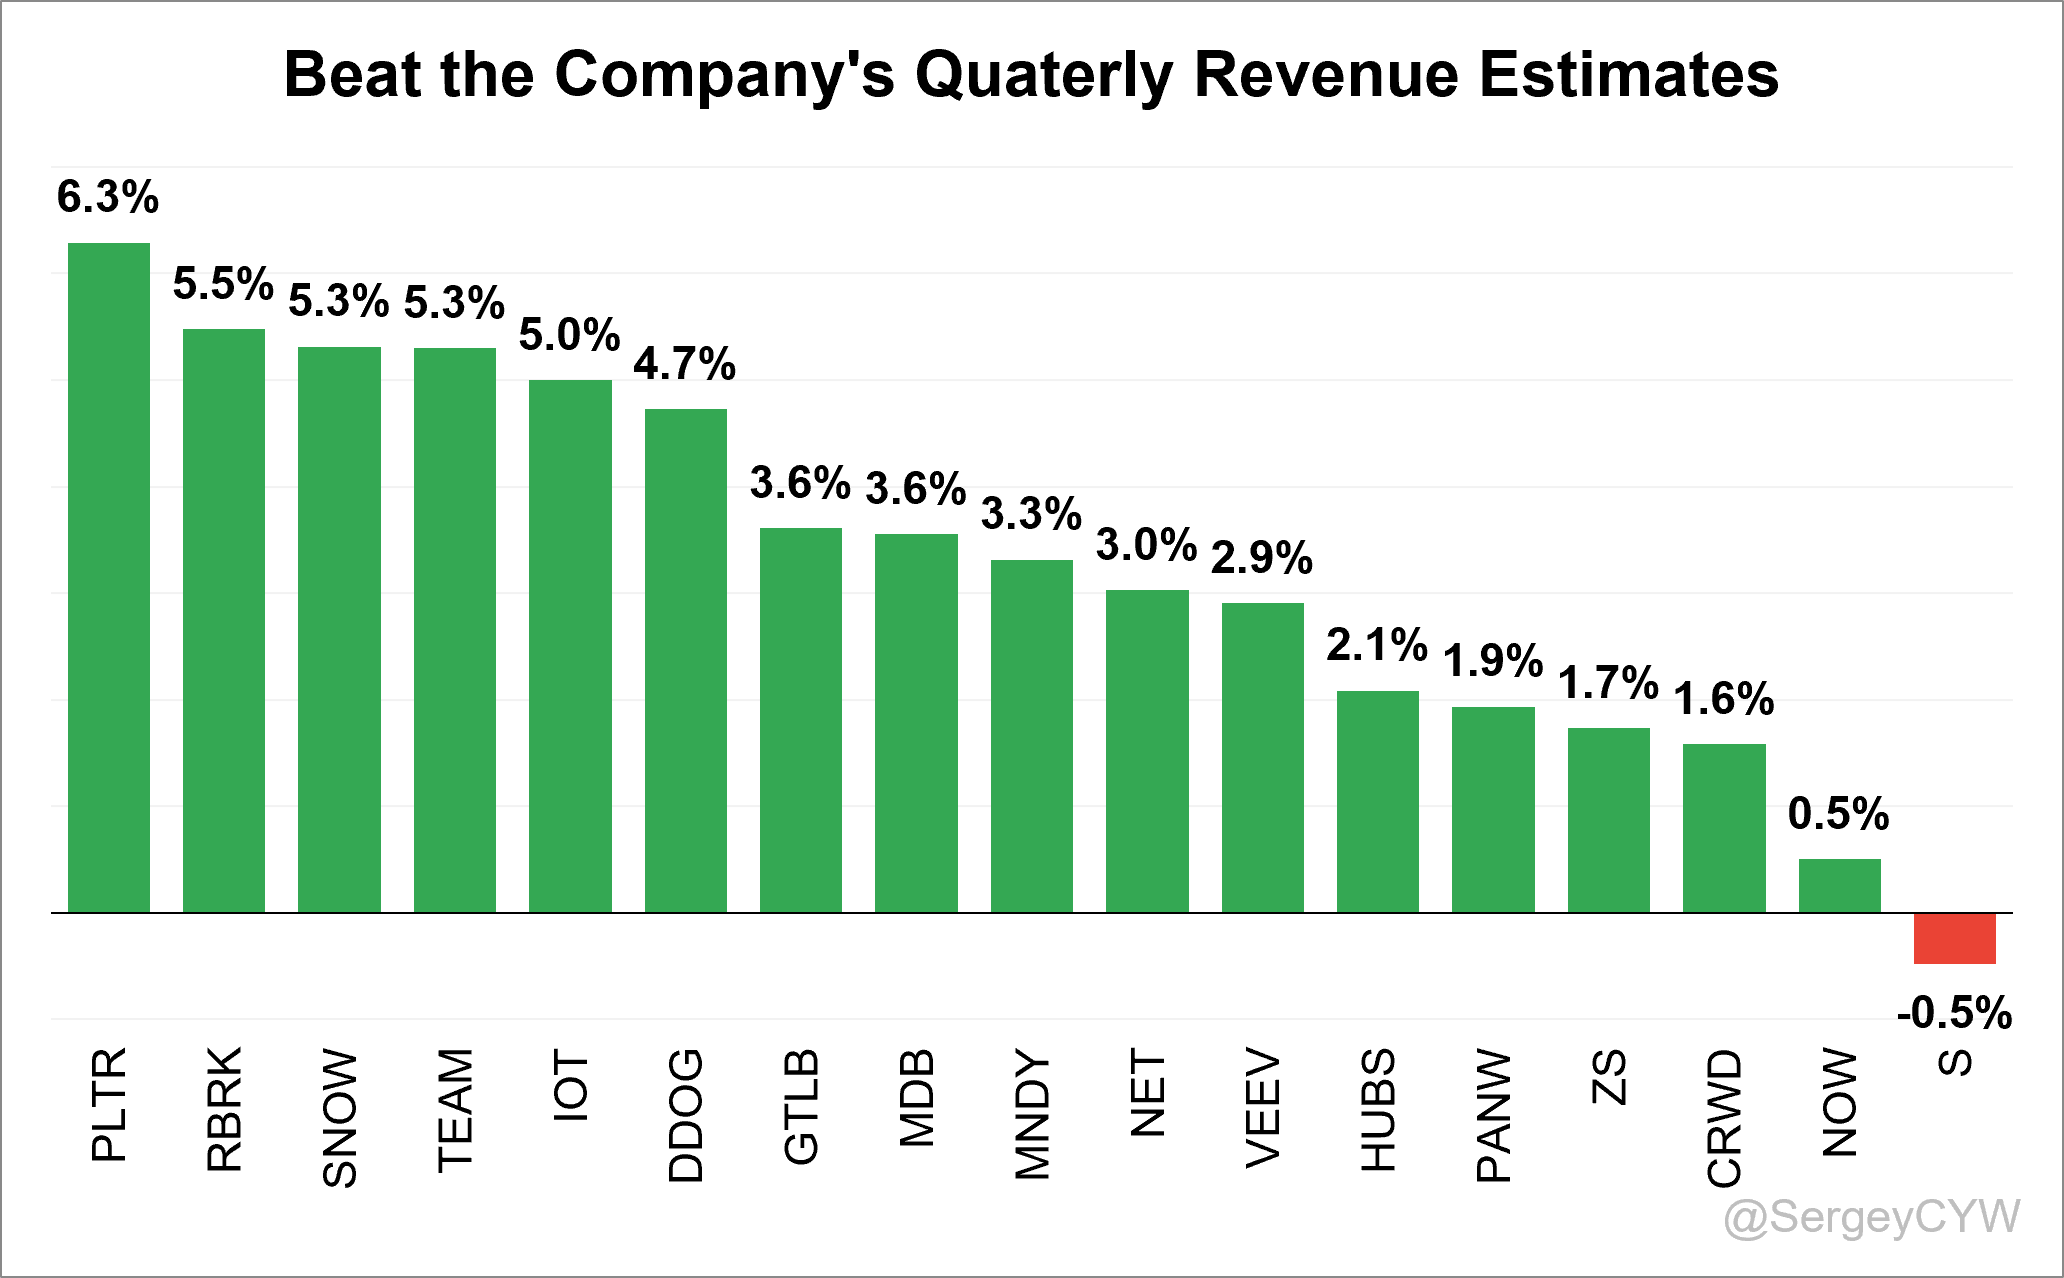
PLTR delivered the largest revenue beat at 6.3%, followed by RBRK (5.5%), SNOW (5.3%), IOT (5.0%), and DDOG (4.7%).
Other notable outperformers included GTLB, MDB, MNDY, NET, and VEEV, with revenue beats ranging from 3.6% to 2.9%.
NOW beat its own revenue guidance by only 0.5%, while SentinelOne (S) reported revenue 0.5% below its own guidance.
Overall, revenue beats across the SaaS sector were strong, highlighting solid execution and continued demand across many software companies despite ongoing concerns around AI-driven disruption.
Changes to Annual Guidance
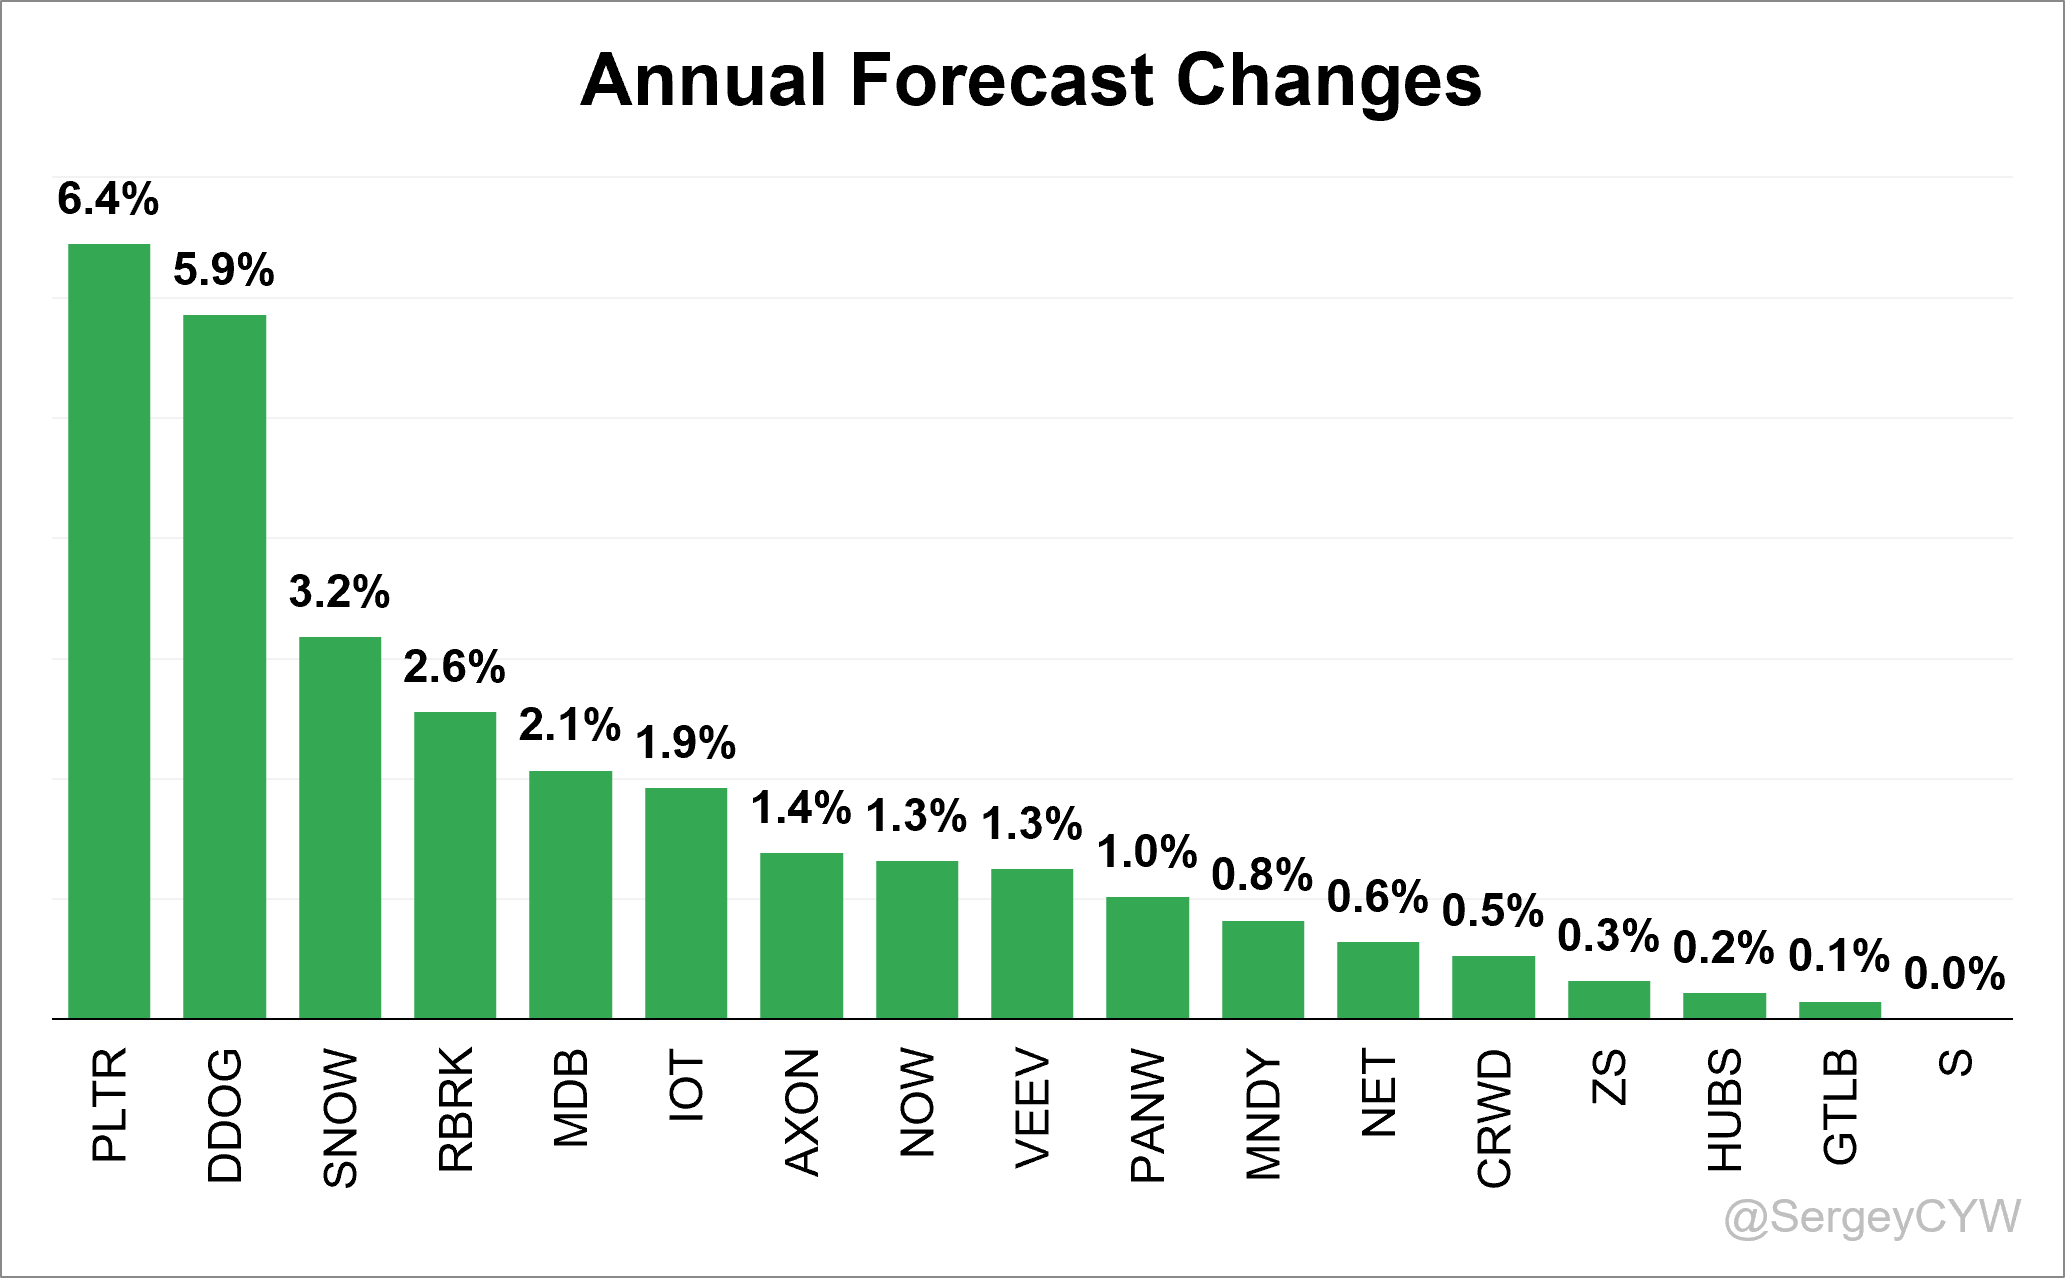
The most notable upward revision came from PLTR, which raised its forecast by 6.4%. DDOG also significantly raised its guidance by 5.9%.
After that, SNOW, RBRK, and MDB each increased their guidance by more than 2.0%, which is also a meaningful raise and signals management optimism.
IOT, AXON, NOW, VEEV, and PANW raised their guidance by more than 1%.
HUBS and GTLB barely raised their forecasts, while SentinelOne (S) kept its annual forecast unchanged.
Dollar-Based Net Retention Rate (DBNRR)
Focusing on the Dollar-Based Net Retention Rate (DBNRR), this metric is crucial for SaaS companies because it reflects customer loyalty and product stickiness. It measures the revenue retained from existing customers over a specific period, including the impact of upgrades, downgrades, and churn.
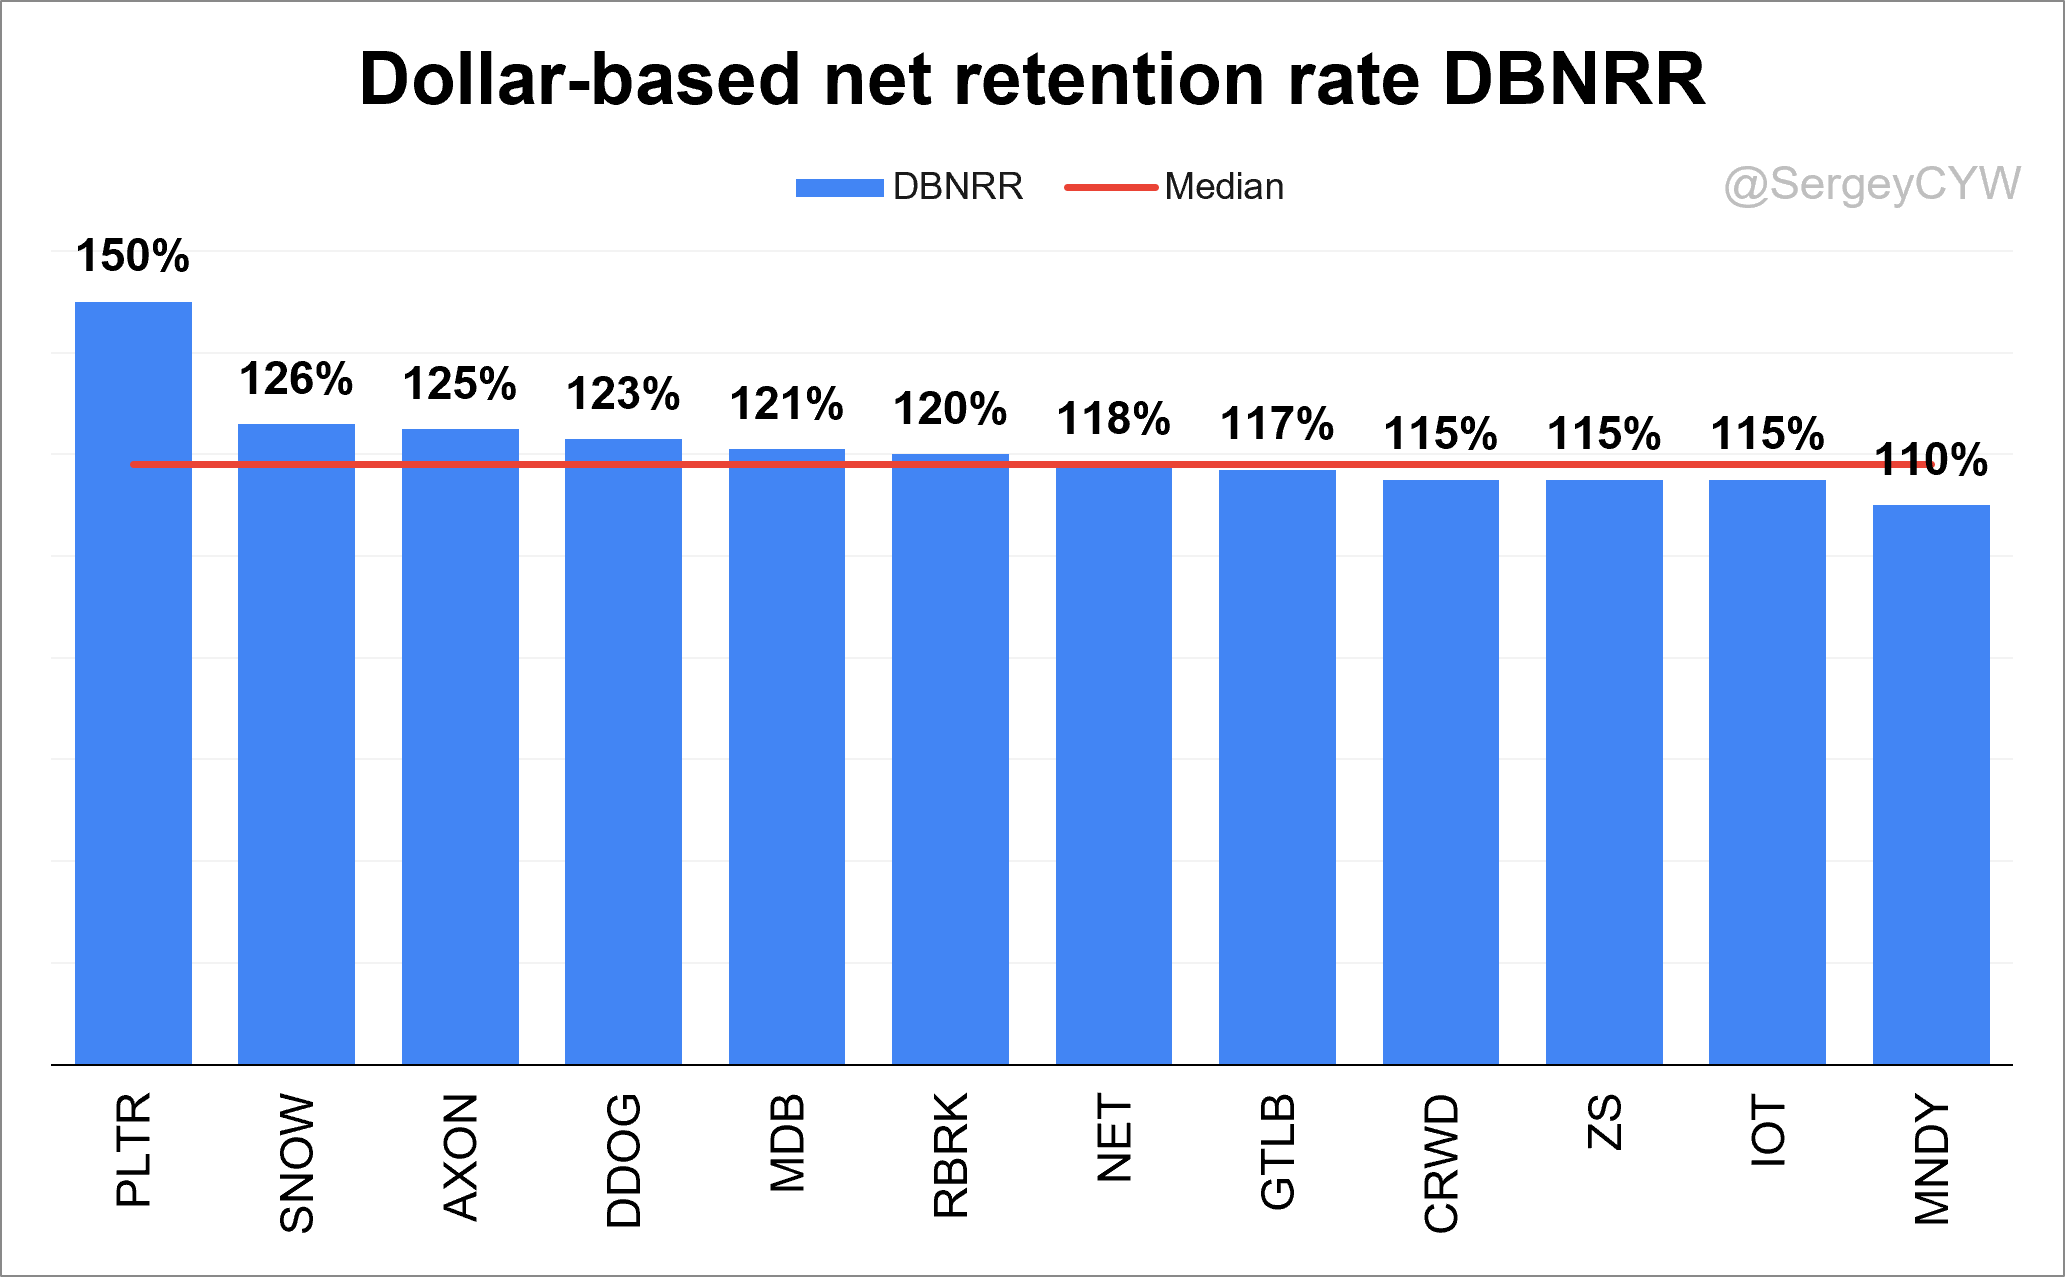
The median DBNRR among the SaaS companies I track declined to 118% from 120% in Q4 2025. However, on an average basis, the metric actually improved, rising from 119% in the previous quarter to 120%.
The strongest result came from PLTR at 150%, up from 139% in the previous quarter. Next were SNOW at 126% (up from 125% in Q4), AXON at 125%, DDOG at 123% (up from 120%), and MDB at 121%. These companies all maintain retention rates above 120%, an exceptional level that highlights strong expansion within their existing customer bases.
Approximately in line with the median level were RBRK at 120% and NET at 118%, although NET declined from 120% in the prior quarter.
Below the median, but still showing solid retention, were GTLB at 117% (down from 118%), along with CRWD, ZS, and IOT, all at 115%.
At the lower end of the group were MNDY at 110% and SentinelOne (S) at 110%, which improved slightly from 109% in the previous quarter.
Expense Prioritization: R&D vs. S&M
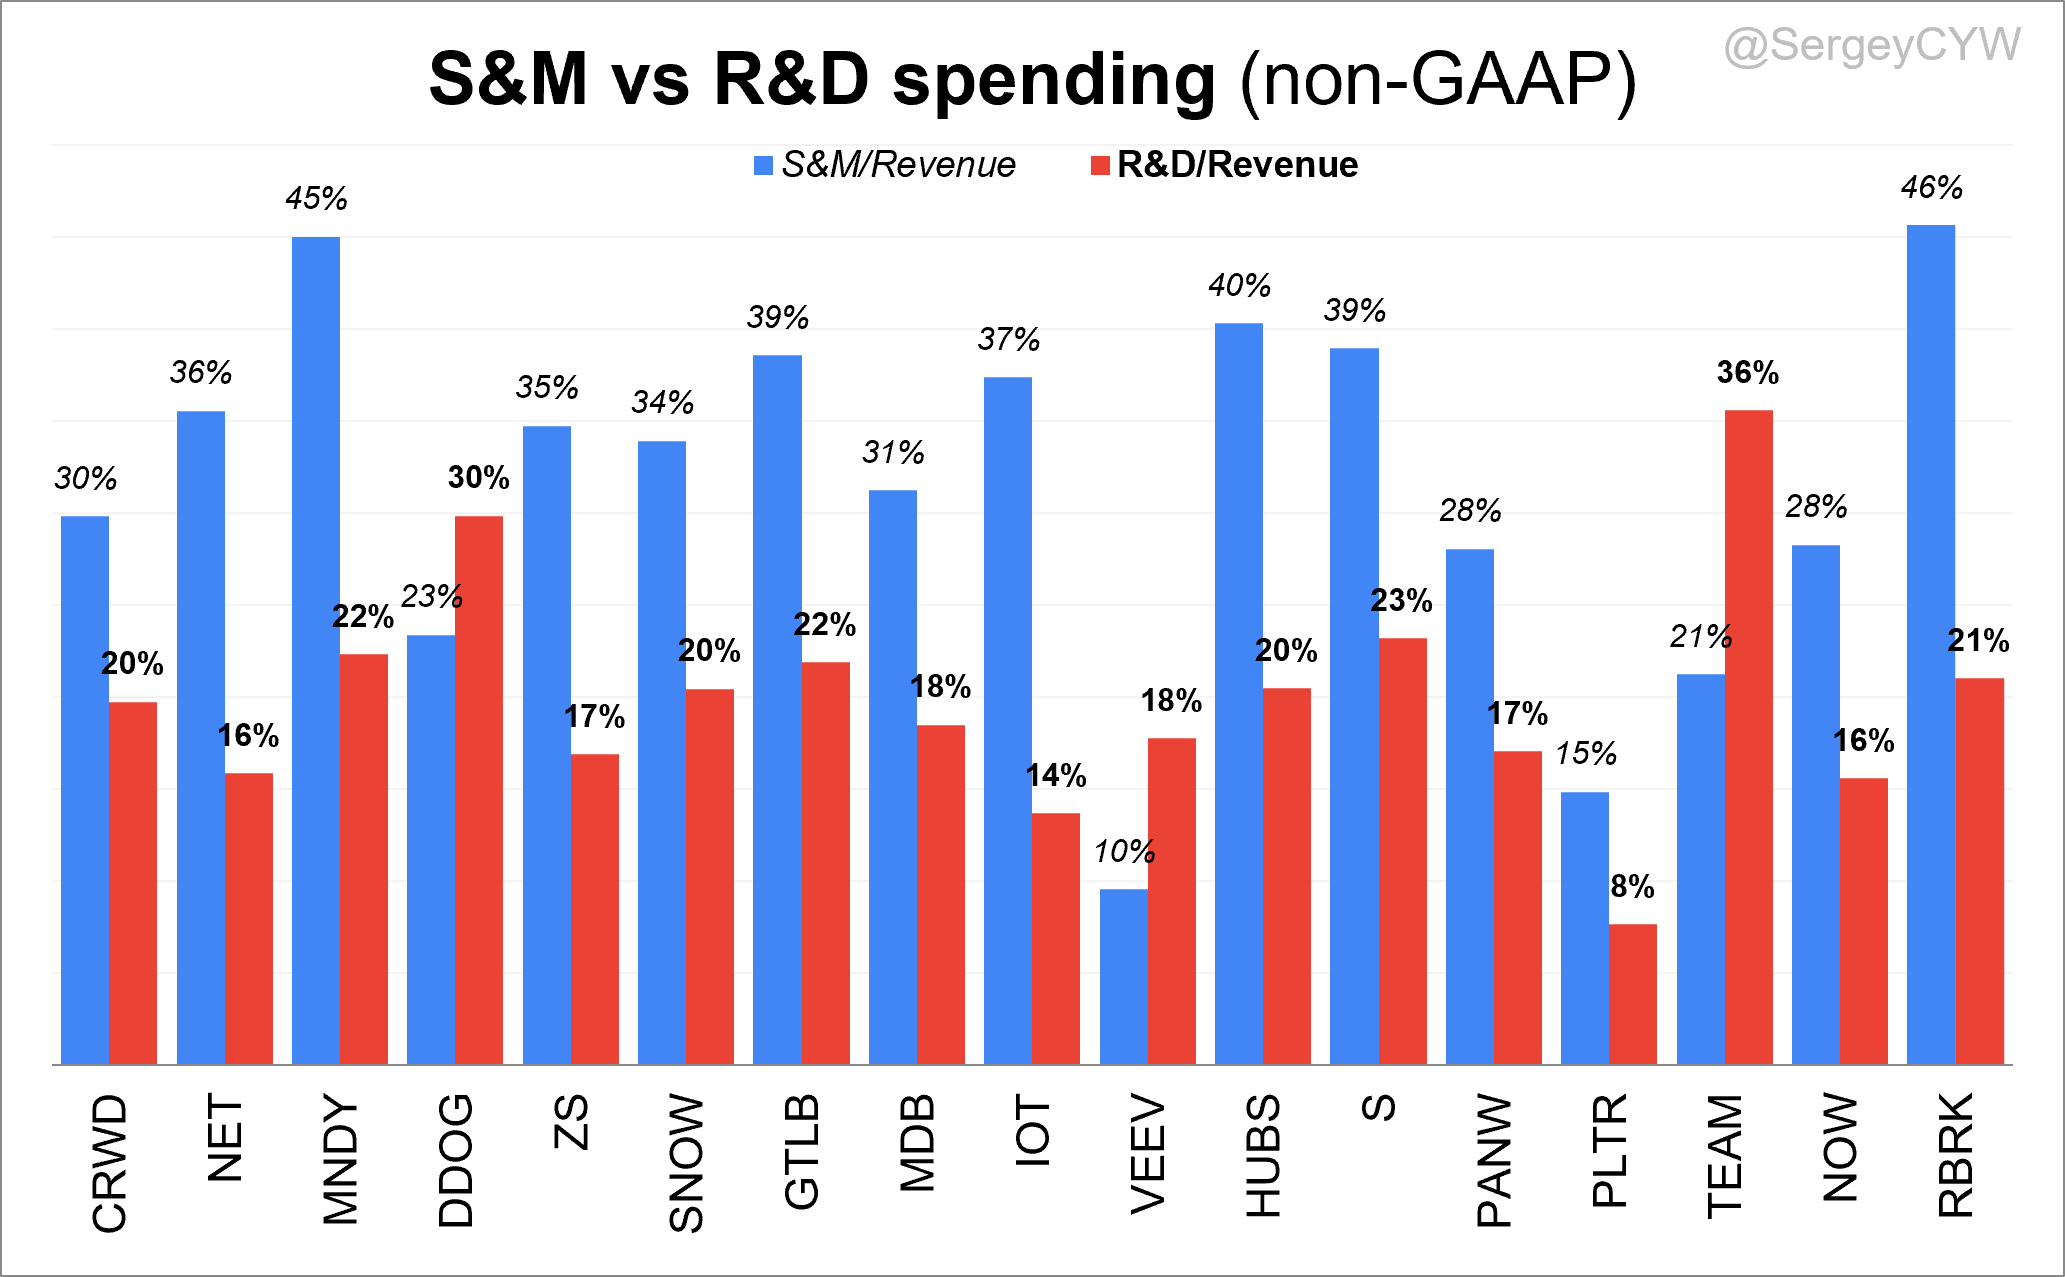
Product-led growth companies thrive when R&D takes precedence over Sales & Marketing. Companies like DDOG, TEAM, and VEEV spend more on R&D than S&M, prioritizing innovation over customer acquisition.
This strategy builds stronger product moats, improves retention, and reduces reliance on costly marketing campaigns. Over time, such companies often benefit from superior margins and more sustainable growth paths.
CAC Payback Period
The Customer Acquisition Cost (CAC) Payback Period is a crucial metric for SaaS companies, measuring the time (in months) it takes to recover the cost of acquiring new customers.
This metric is essential for evaluating the efficiency of a company’s sales and marketing efforts. A shorter CAC Payback Period generally indicates a more effective go-to-market strategy and a product that resonates well with customers.
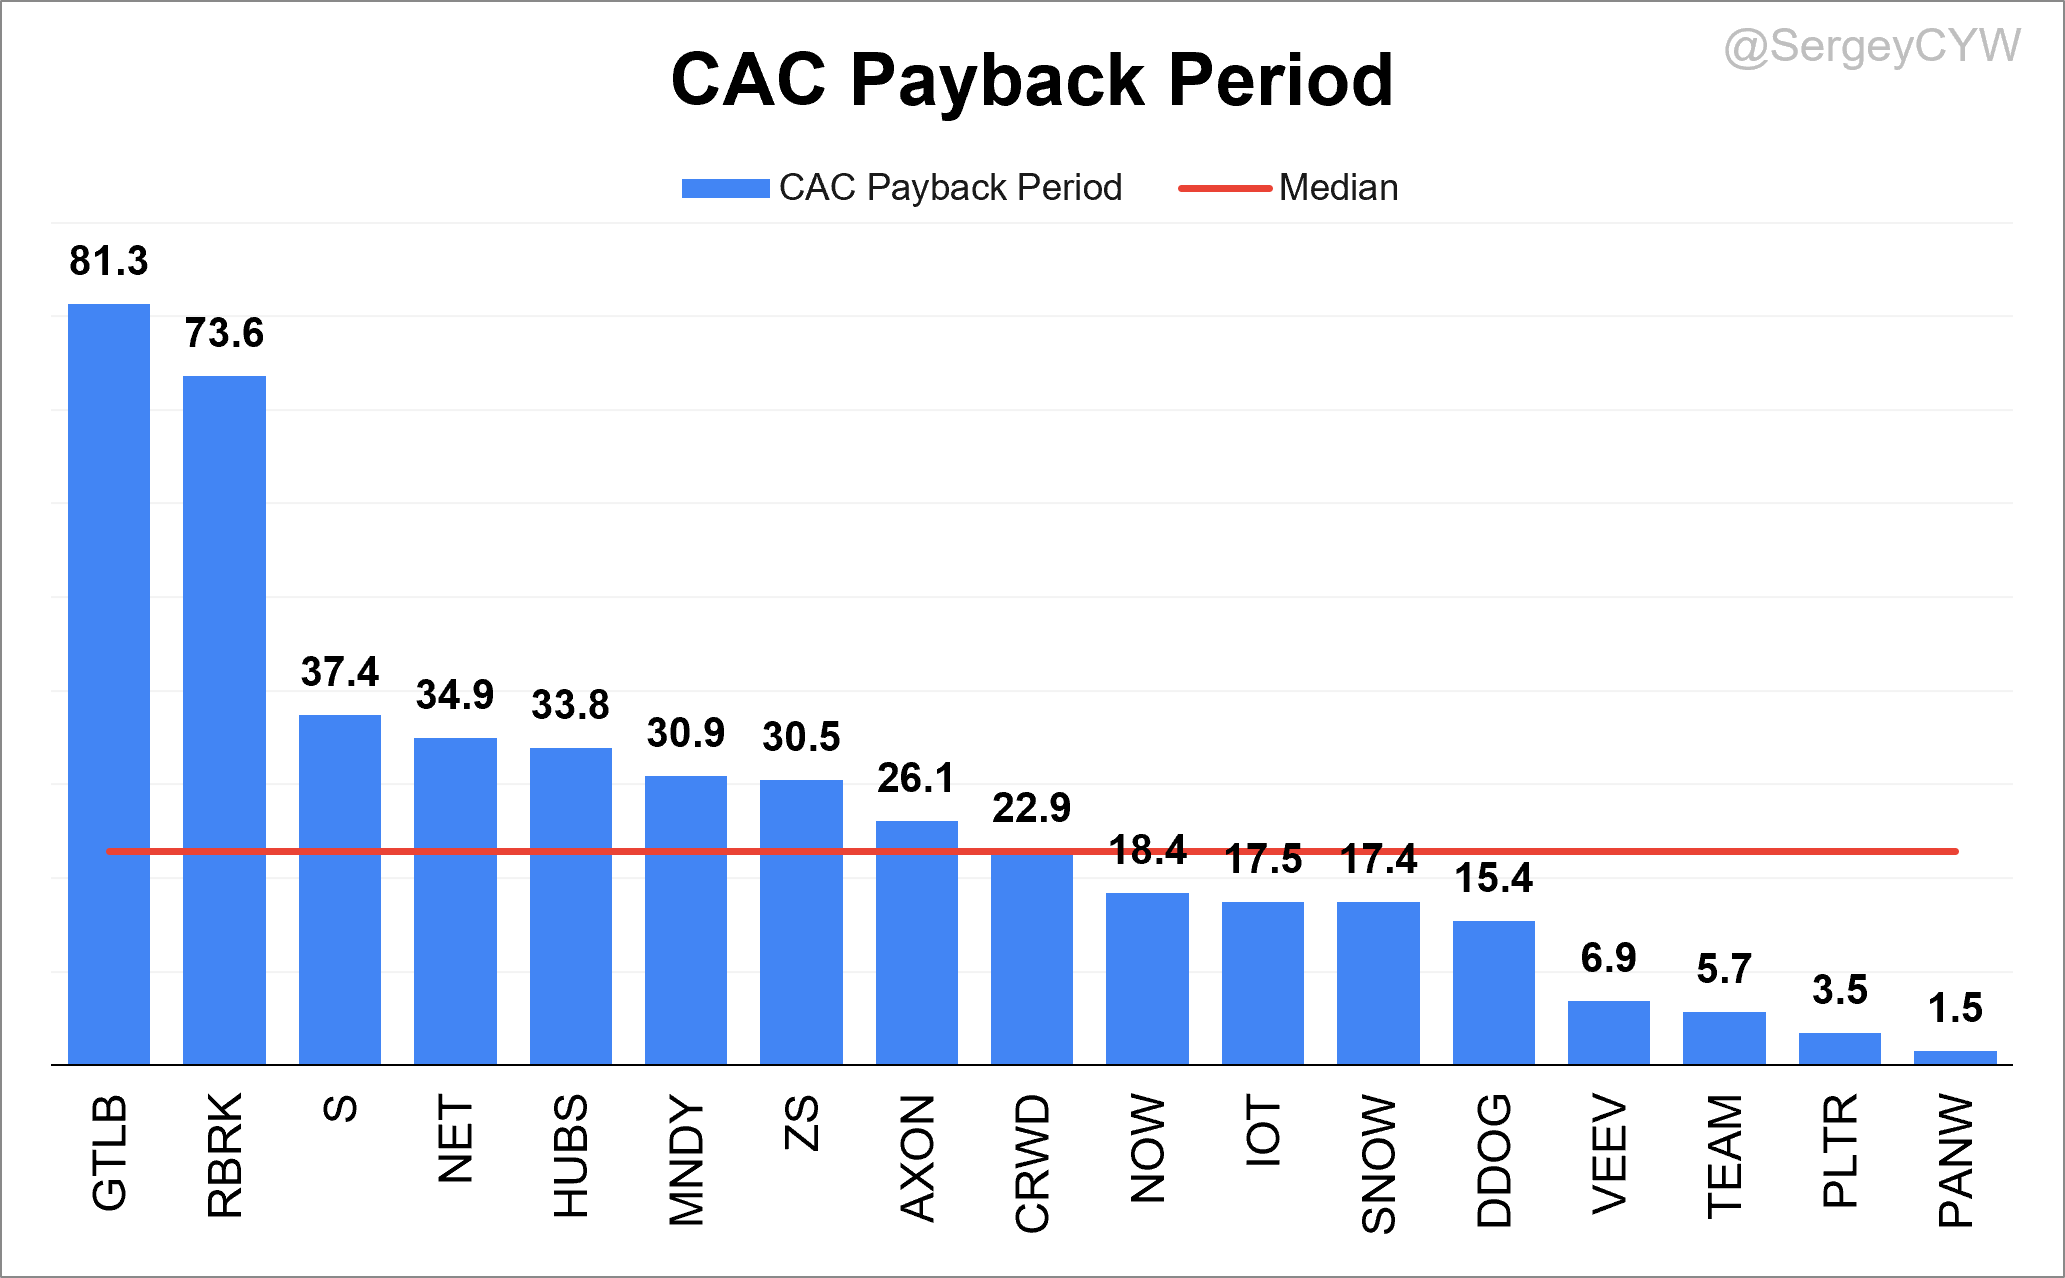
In Q1 2026, the companies with the least favorable CAC Payback Periods included GTLB at 81.3 months and RBRK at 73.6 months.
For GTLB, Q1 is seasonally the weakest quarter of the year, which partially explains the elevated payback period. For RBRK, the metric appears worse because of the declining contribution of Material Rights revenue to quarterly results. Excluding Material Rights, RBRK’s CAC Payback Period would be approximately 36.7 months, which still ranks among the weaker results within the group.
On the other end of the spectrum, the best performers were PANW with a payback period of 1.5 months and PLTR at 3.5 months. In PANW’s case, however, the metric is distorted by the impact of several large recent acquisitions.
The median CAC Payback Period among the SaaS companies I monitor was 22.9 months, up from 19.3 months in the previous quarter for this group of companies.
For AXON, the CAC Payback Period for the Software & Services segment was 26.1 months, although it is worth noting that subscription revenue accounts for only about 40% of total revenue, making direct comparisons with pure SaaS companies less straightforward.
Companies performing approximately in line with the median include CRWD, NOW, IOT, SNOW, and DDOG.
R&D Index (RDI Score)
The R&D Index (RDI Score) is a key metric that evaluates how efficiently SaaS companies convert their R&D investments into organic revenue growth. In a competitive landscape, innovation drives customer satisfaction, retention, and long-term expansion. Companies with higher RDI scores consistently outperform peers, delivering stronger total shareholder returns (TSR).
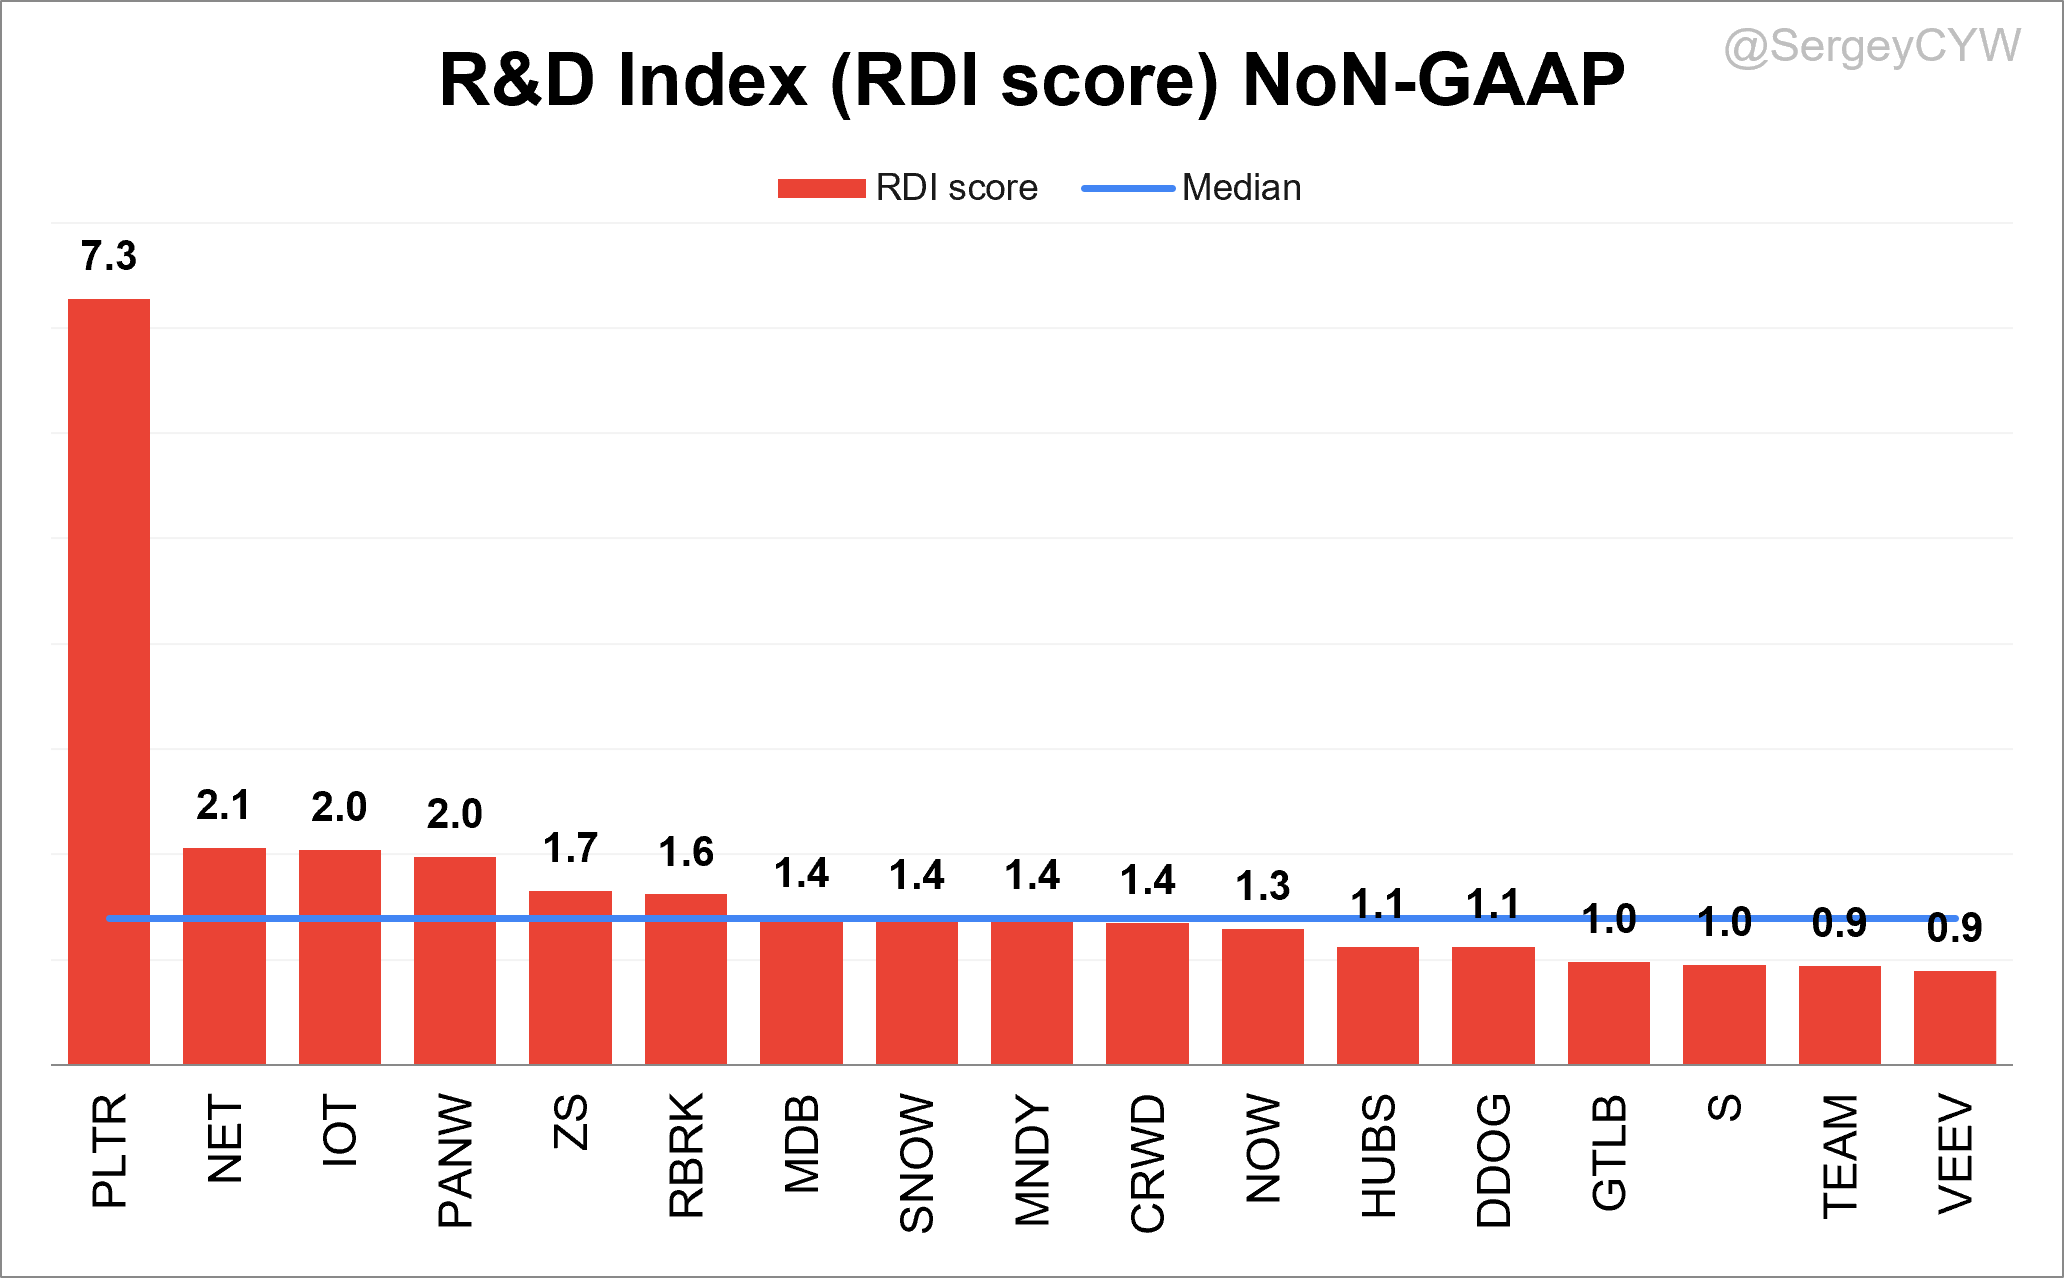
An RDI Score above 1.4 means a company generates more than $1.40 in revenue for every $1 spent on R&D—a hallmark of best-in-class performance. For context, the industry median is around 0.7, but among leading SaaS names, this metric often exceeds 1.3, signaling exceptional efficiency and innovation.
In Q1 2026, the top performers by RDI Score were: PLTR as the clear leader by a wide margin, with a score of 7.3, followed by NET at 2.1, and IOT and PANW at 2.0.
The median RDI Score for the SaaS companies I track is 1.4, up from 1.2 in the previous quarter.
At the lower end were VEEV and TEAM, with an RDI Score of 0.9, which is still above the industry median, but indicates less efficient R&D investment compared to peers within the analyzed group of stocks.
SaaS Magic Number
The SaaS Magic Number is a pivotal metric used to evaluate the efficiency of sales and marketing investments within SaaS companies.
It offers investors and managers a clear view of how effectively a company is converting its sales and marketing spend into revenue growth, which is particularly crucial for businesses that follow a subscription-based model.
In the SaaS industry, customer acquisition costs are typically high but lead to prolonged revenue streams.
Interpretation of the SaaS Magic Number
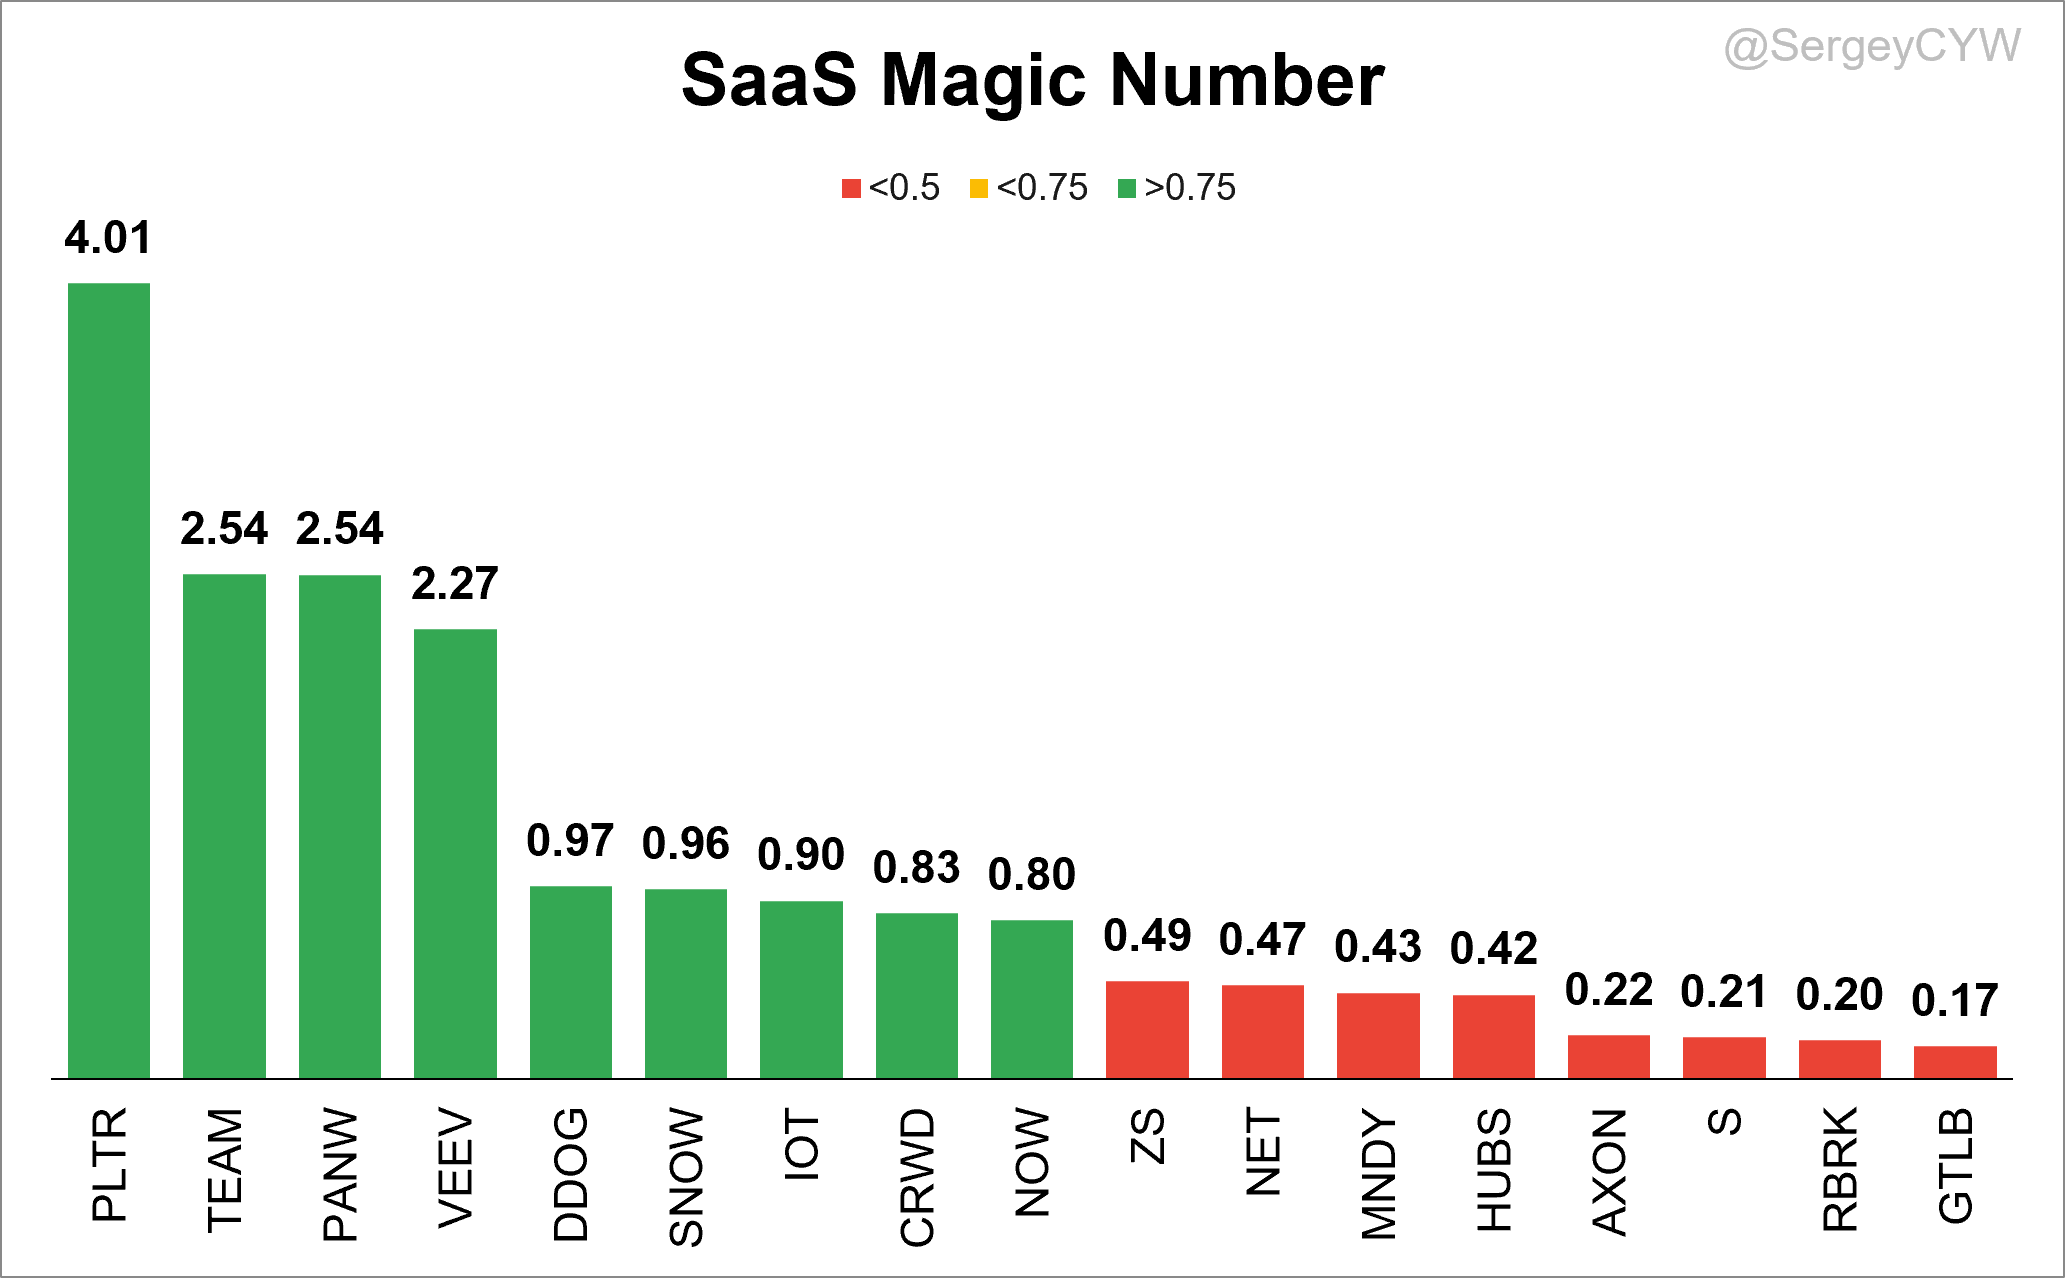
Magic Number > 0.75: Indicates high efficiency in sales and marketing efforts. Companies achieving this level are generally considered to be effectively utilizing their investments in these areas and may safely increase spending to drive growth.
Magic Number between 0.5 and 0.75: Suggests moderate efficiency. Companies in this range are seeing some return on sales and marketing spend but should explore ways to optimize these investments.
Magic Number < 0.5: Reflects poor efficiency. Companies with a magic number below 0.5 may need to reassess their sales strategies or marketing campaigns, as their investments are not translating effectively into revenue growth.
Limitations of the SaaS Magic Number
Seasonality and Sales Cycles: The metric does not account for the effects of seasonality and sales cycles.
Growth Stage Influence: The metric might be misleading for very early-stage companies or those in a rapid expansion phase, where sales and marketing spend is aggressively high.
🟢Magic Number > 0.75: PLTR, TEAM, PANW, VEEV, DDOG, SNOW, IOT, CRWD, NOW.
🟠Magic Number > 0.5: -.
🔴Magic Number < 0.5: ZS, NET, MNDY, HUBS, AXON, S, RBRK, GTLB.
Margins and Profitability
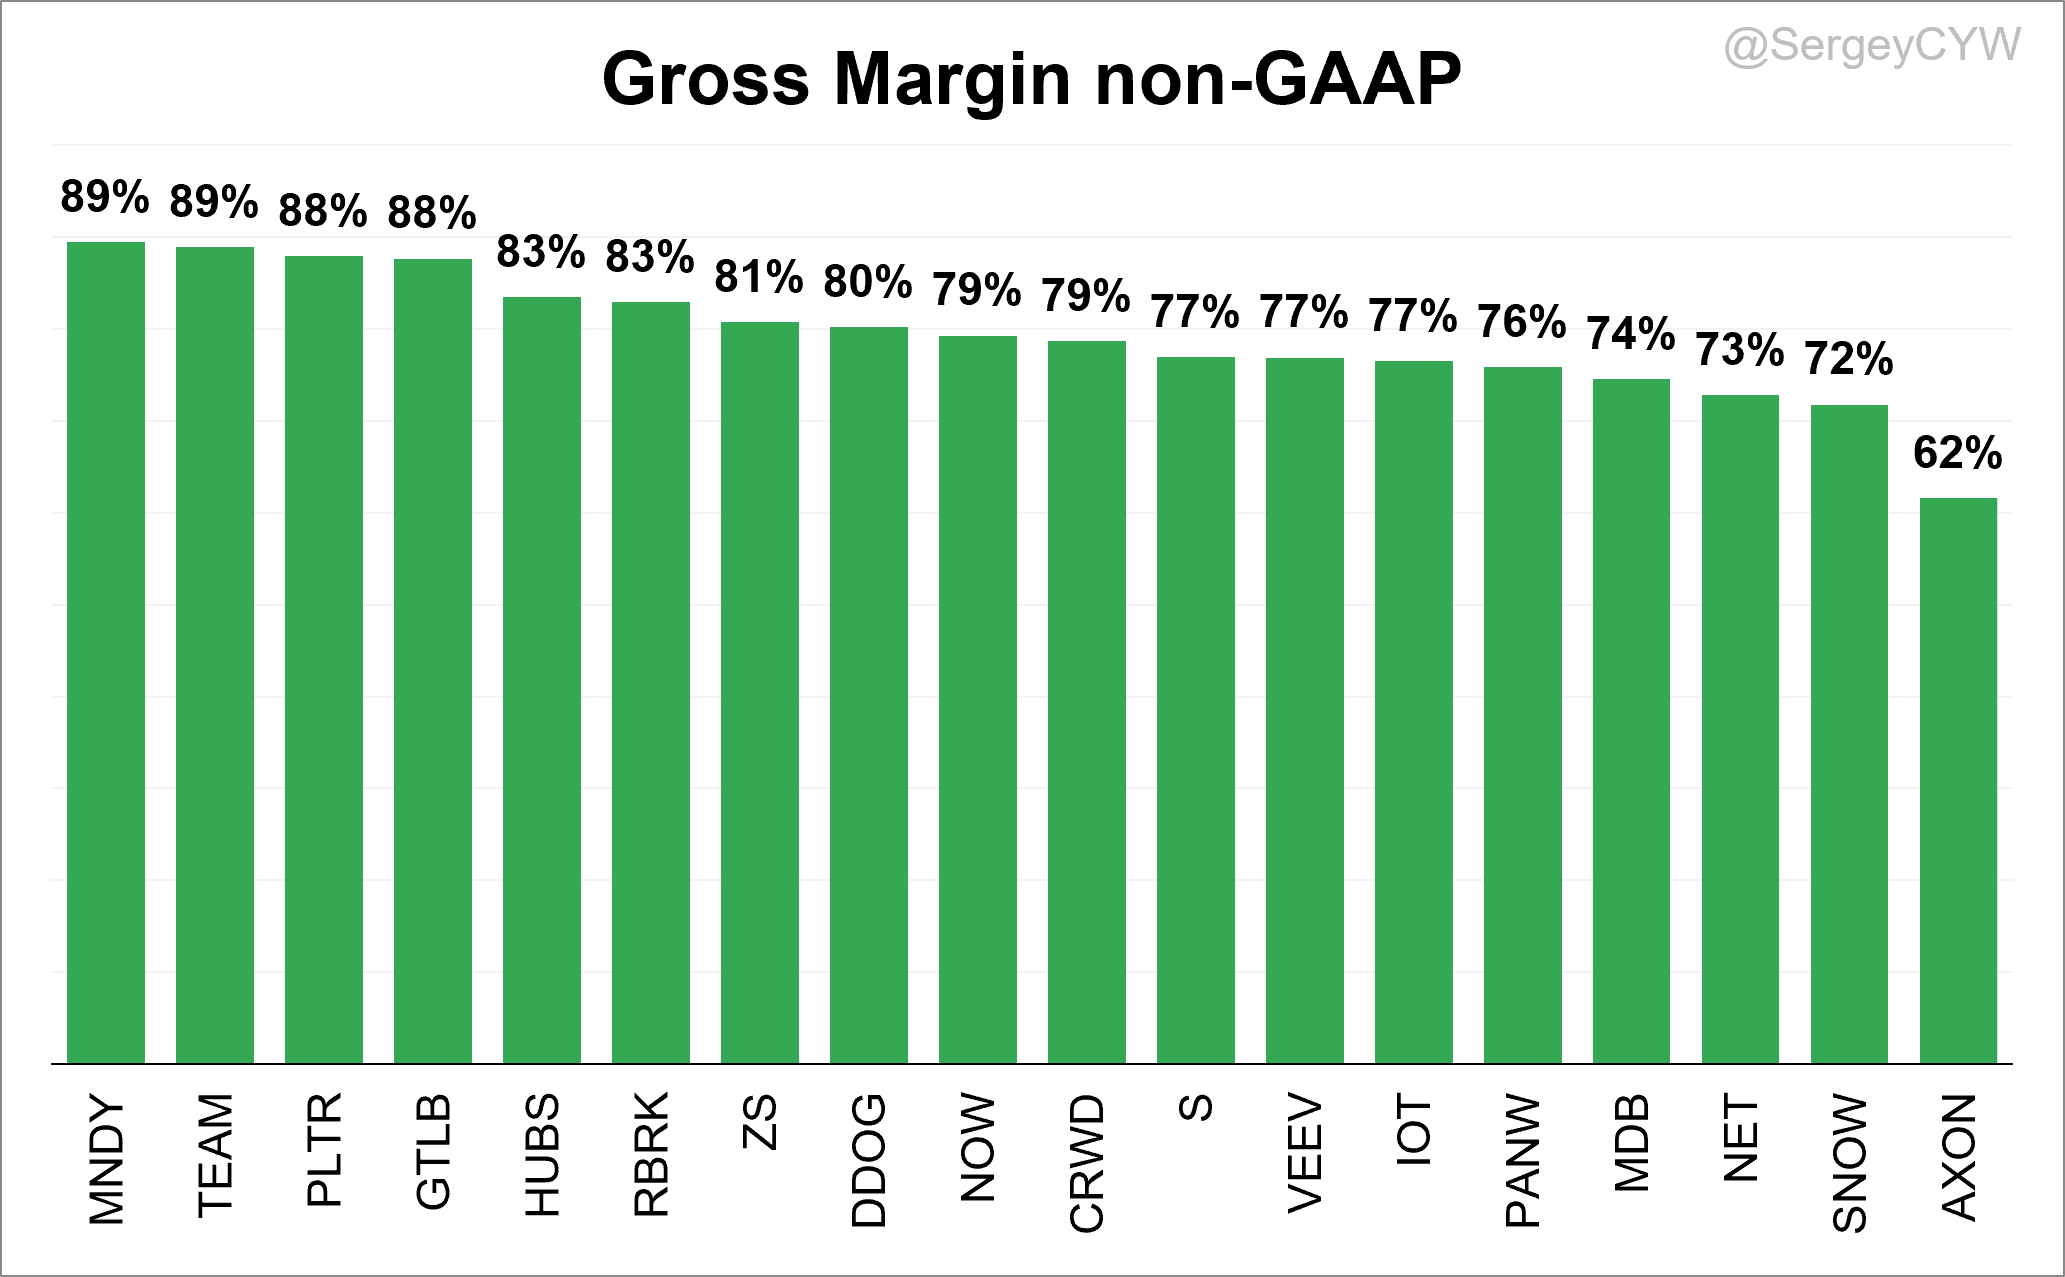
Next, let's discuss margins, starting with Gross Margin non-GAAP. For AXON, the Gross Margin is 61.6%, but specifically for Software & Services, it’s 72.4%. The highest Gross Margins are seen at MNDY and TEAM at 89%, PLTR and GTLB at 88%.
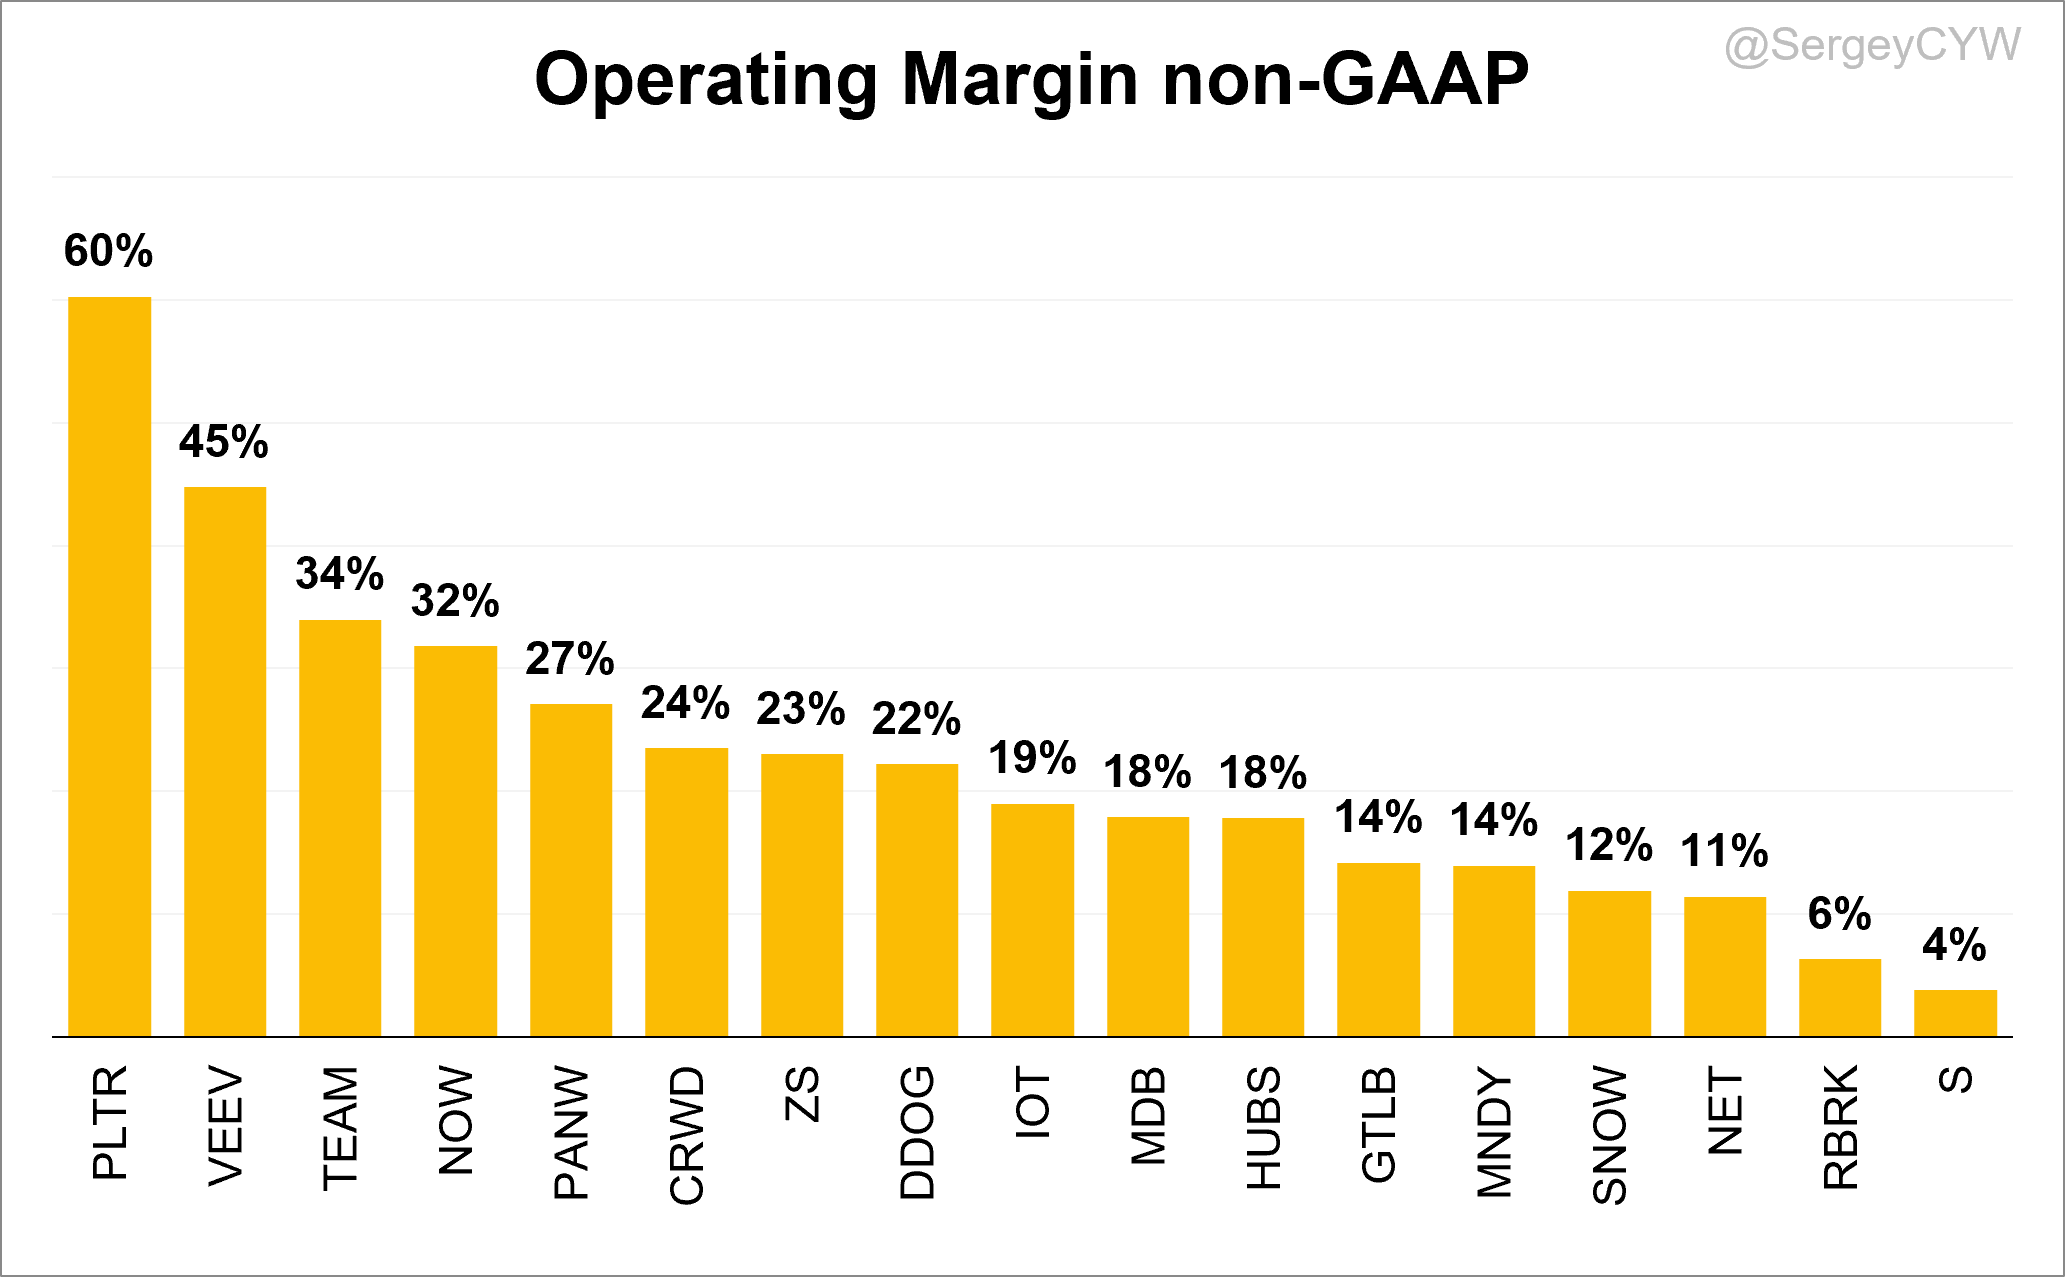
Regarding non-GAAP Operating Margins, the highest performers are PLTR at 60% and VEEV at 45%. Following them, with strong operating margins above 25%, are TEAM, NOW, and PANW.
Companies that are still in earlier stages of profitability include RBRK with a 6% operating margin and SentinelOne (S) at 4%.
It is also worth highlighting that several companies have significantly improved their operating margins over the past few years and have successfully transitioned to profitability.
SentinelOne (S) is one such example. Its operating margin was -1.7% a year ago, but has since turned positive 3.8%.
IOT has made particularly impressive progress. Its operating margin was -9% in Q1 2023, improved to 2% in Q1 2024, and has now expanded further to 19%, demonstrating strong execution and meaningful progress toward sustainable profitability.
Similarly, GTLB successfully transitioned to positive operating margins, improving from -12% in Q1 2023 to 14% today.
RBRK has also shown notable improvement. In Q1 of the prior year, its operating margin was -6.5%, while it has now improved to a positive 6.5%, reflecting continued operating leverage and progress toward long-term profitability.
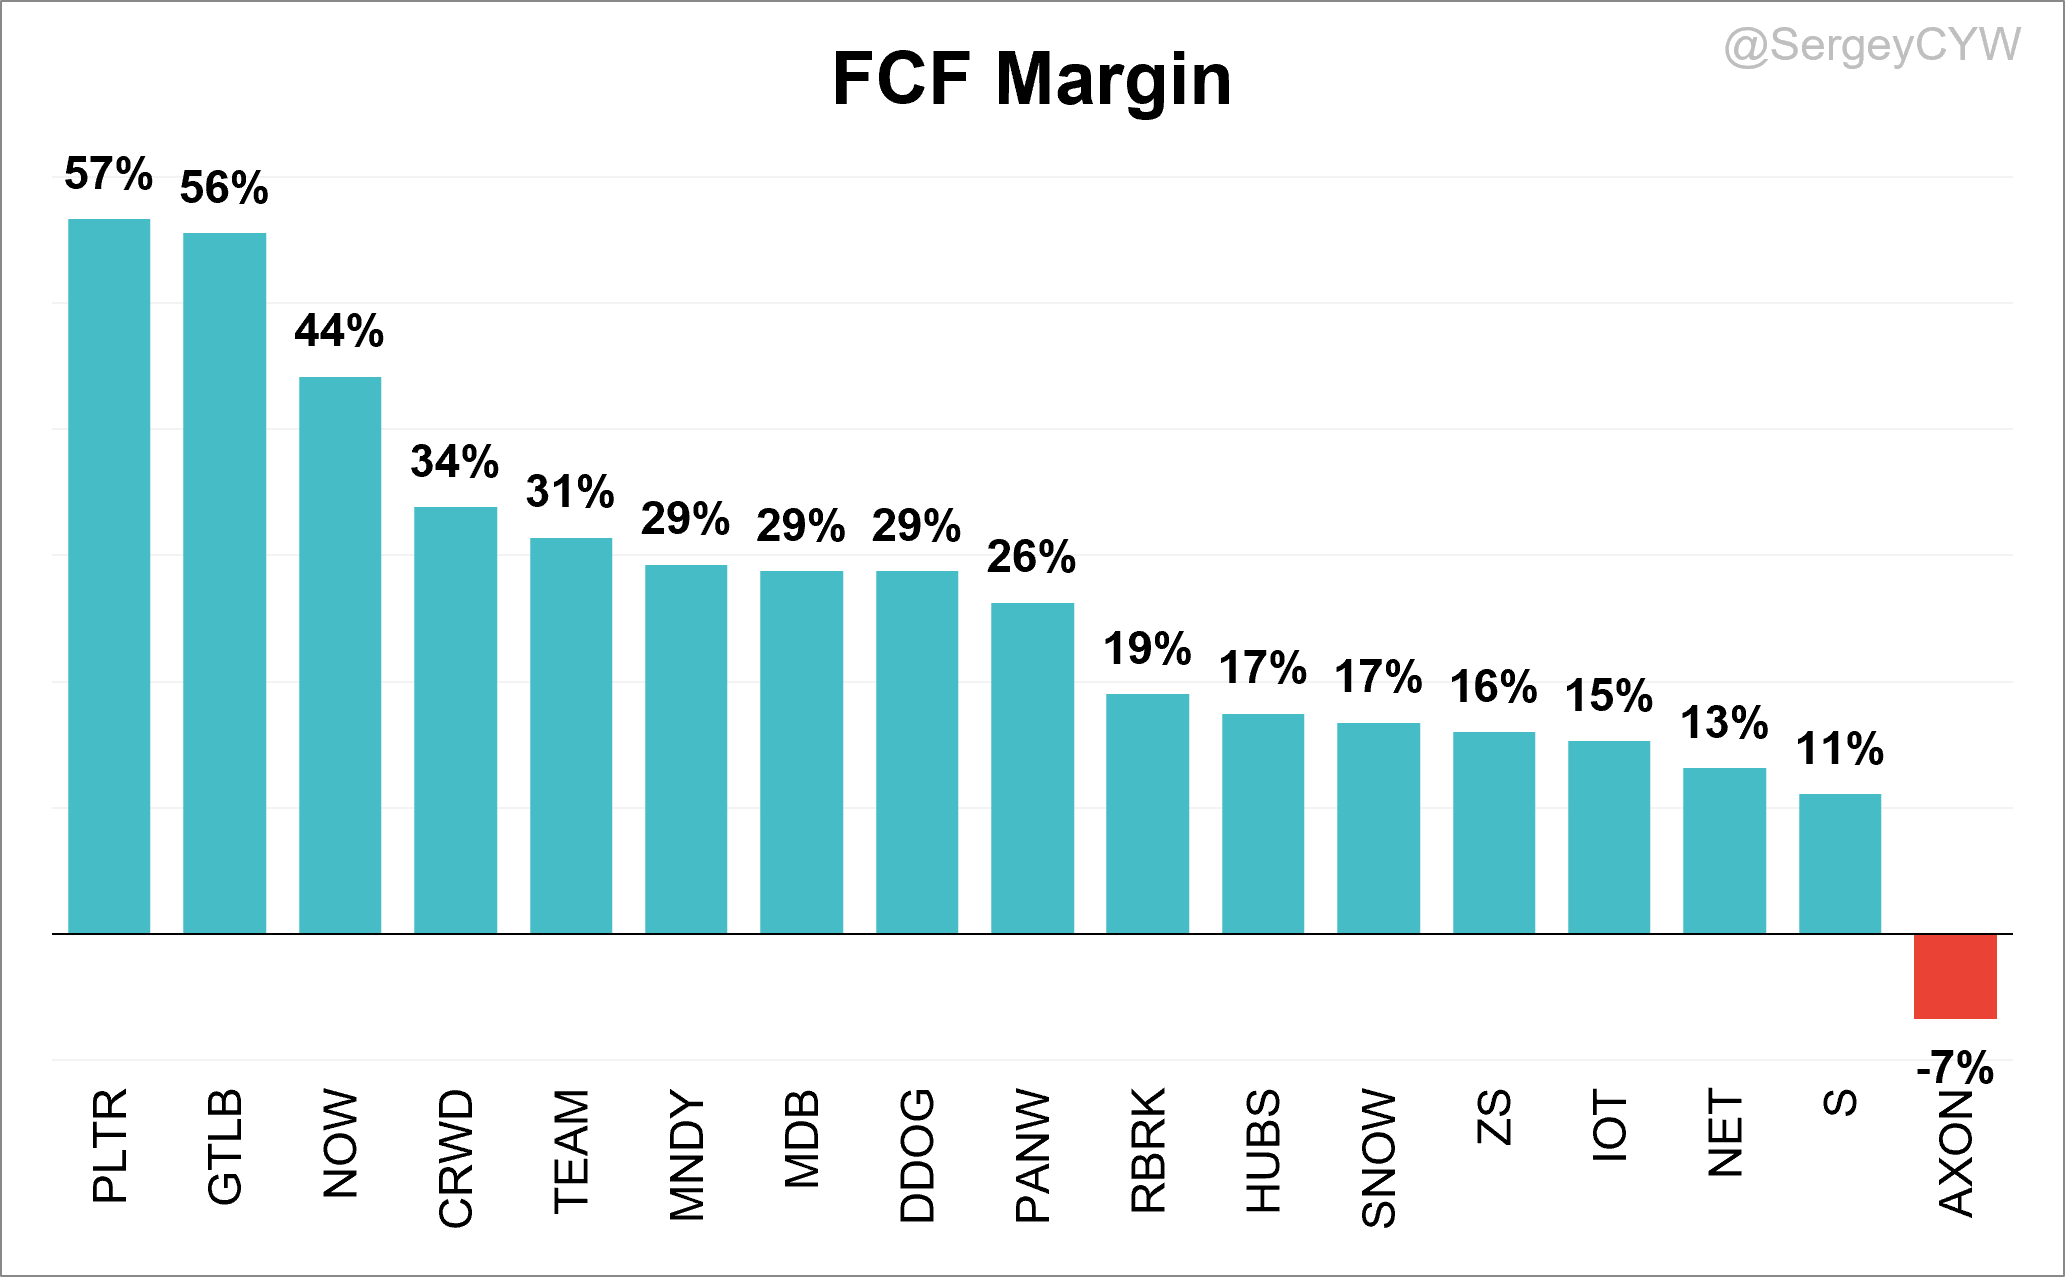
For Q1 2026, the highest Free Cash Flow margin was reported by PLTR at 57%, GTLB at 56%, and NOW at 44%.
Other strong performers included CRWD, TEAM, MNDY, MDB, DDOG, and PANW, all with FCF margins above 20%.
Notably, PLTR posted a 57% FCF margin alongside very strong revenue growth of +85% YoY.
For AXON, FCF margin was -6.8%, down 6.9 percentage points YoY, pressured by inventory build, bonus payments, commissions, and interest payments. However, management expects a recovery in the second half of the year.
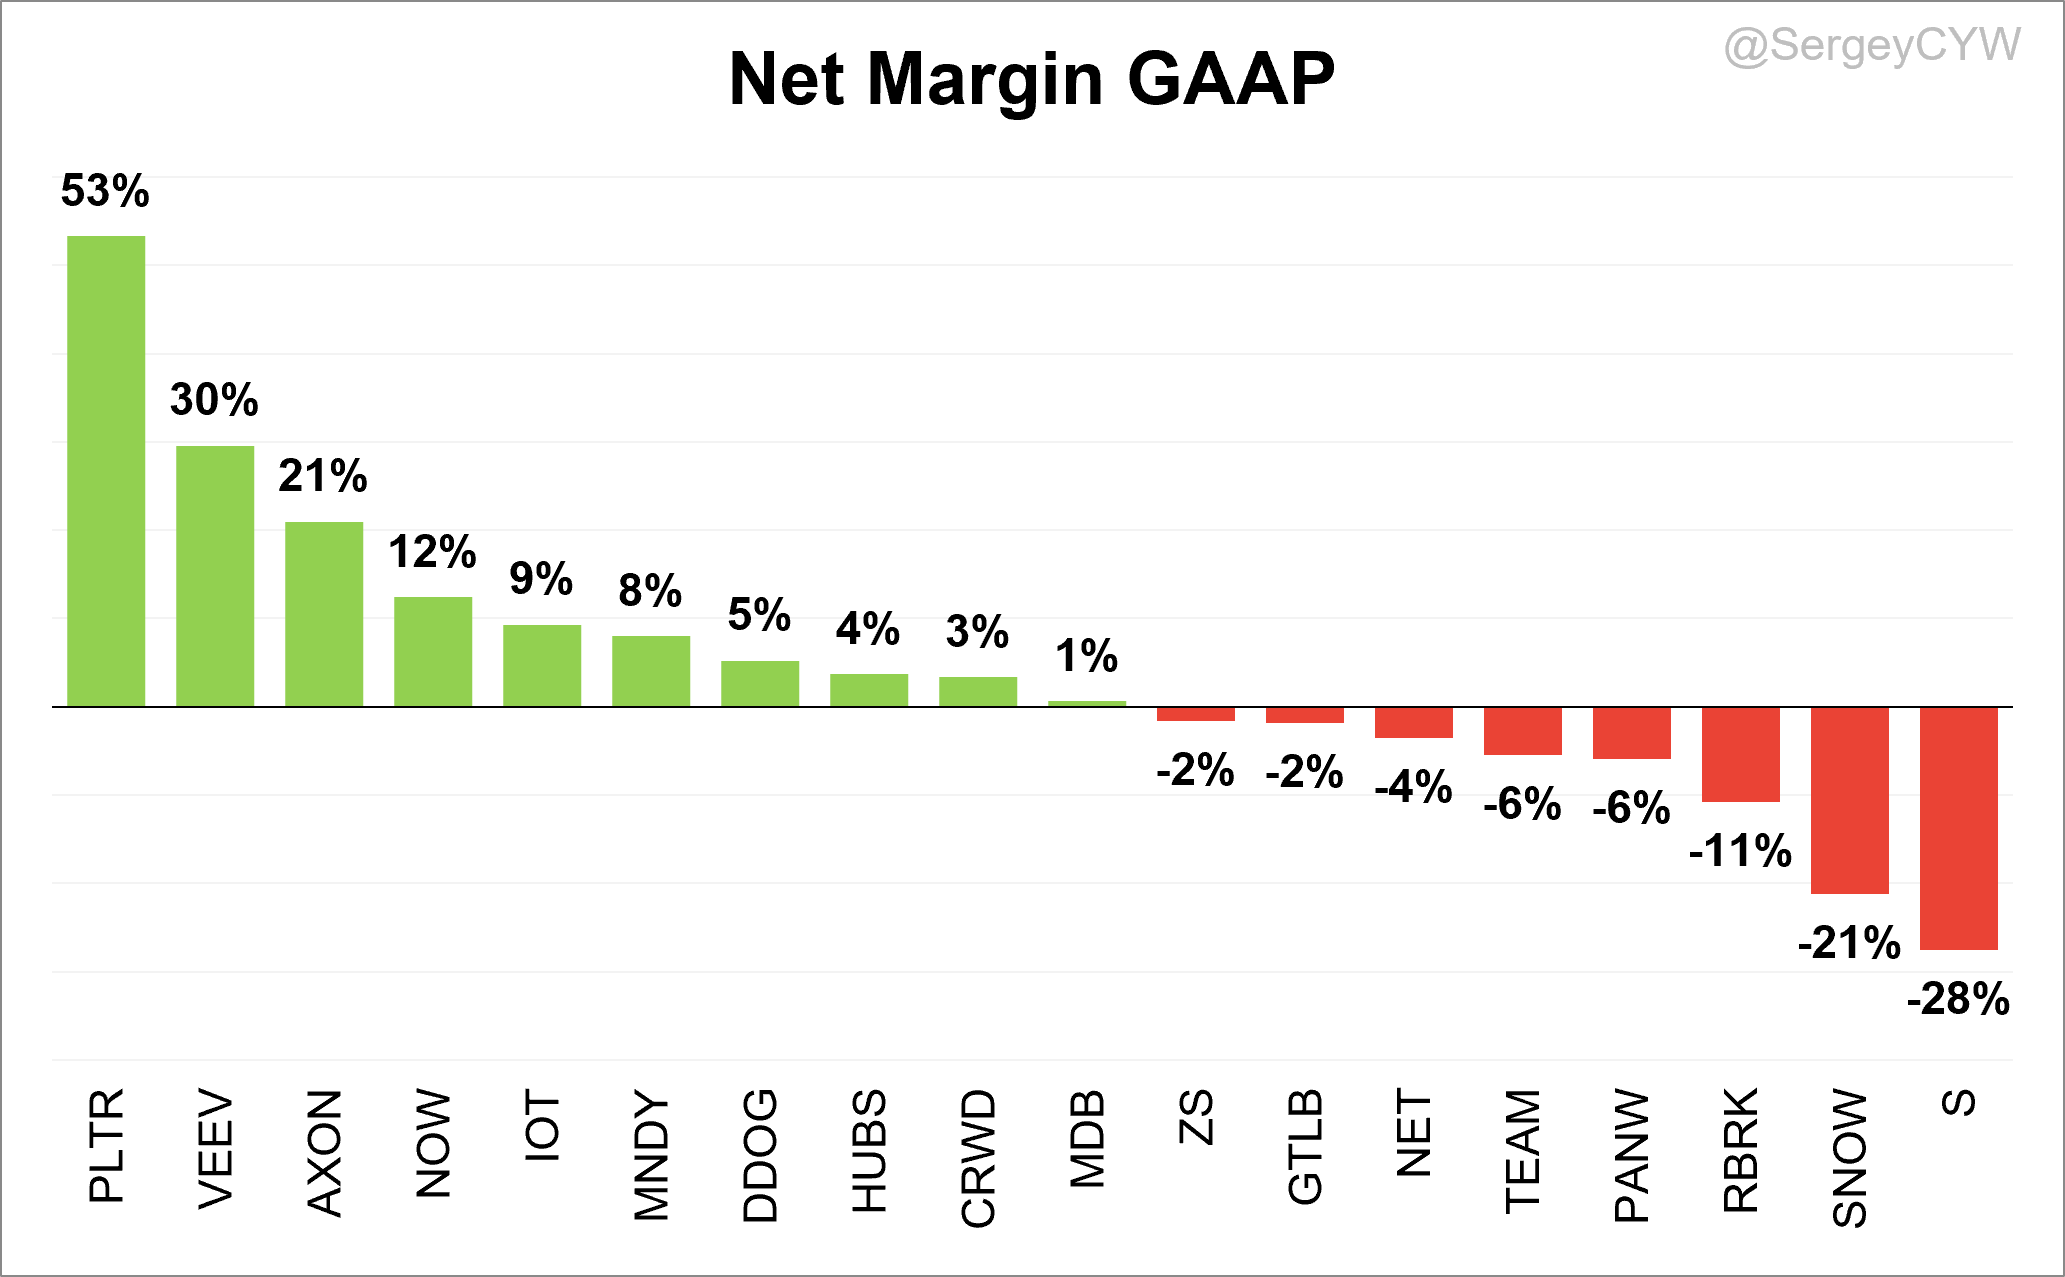
Looking at GAAP net margins for Q1 2026, it is worth noting that most companies improved their net margins.
SentinelOne (S) showed one of the most negative margins at -28%, though this improved from -41% in the previous quarter. It was followed by SNOW at -21%, which also improved slightly from -23%, and RBRK at -11%, improving from -23%.
On the other side, PLTR stands out with a strong 53% GAAP net margin, improving from 43%, while VEEV shows solid profitability at 30%.
Stock-Based Compensation and Dilution
Next, let’s examine Stock-Based Compensation (SBC) relative to company revenues.
SBC is a critical tool for SaaS companies—essential for attracting and retaining top talent while aligning employee interests with the long-term success of the business. However, it requires thoughtful management, as excessive SBC can lead to shareholder dilution and negatively impact earnings per share, both of which are key factors for investors assessing a company's financial health and long-term potential.
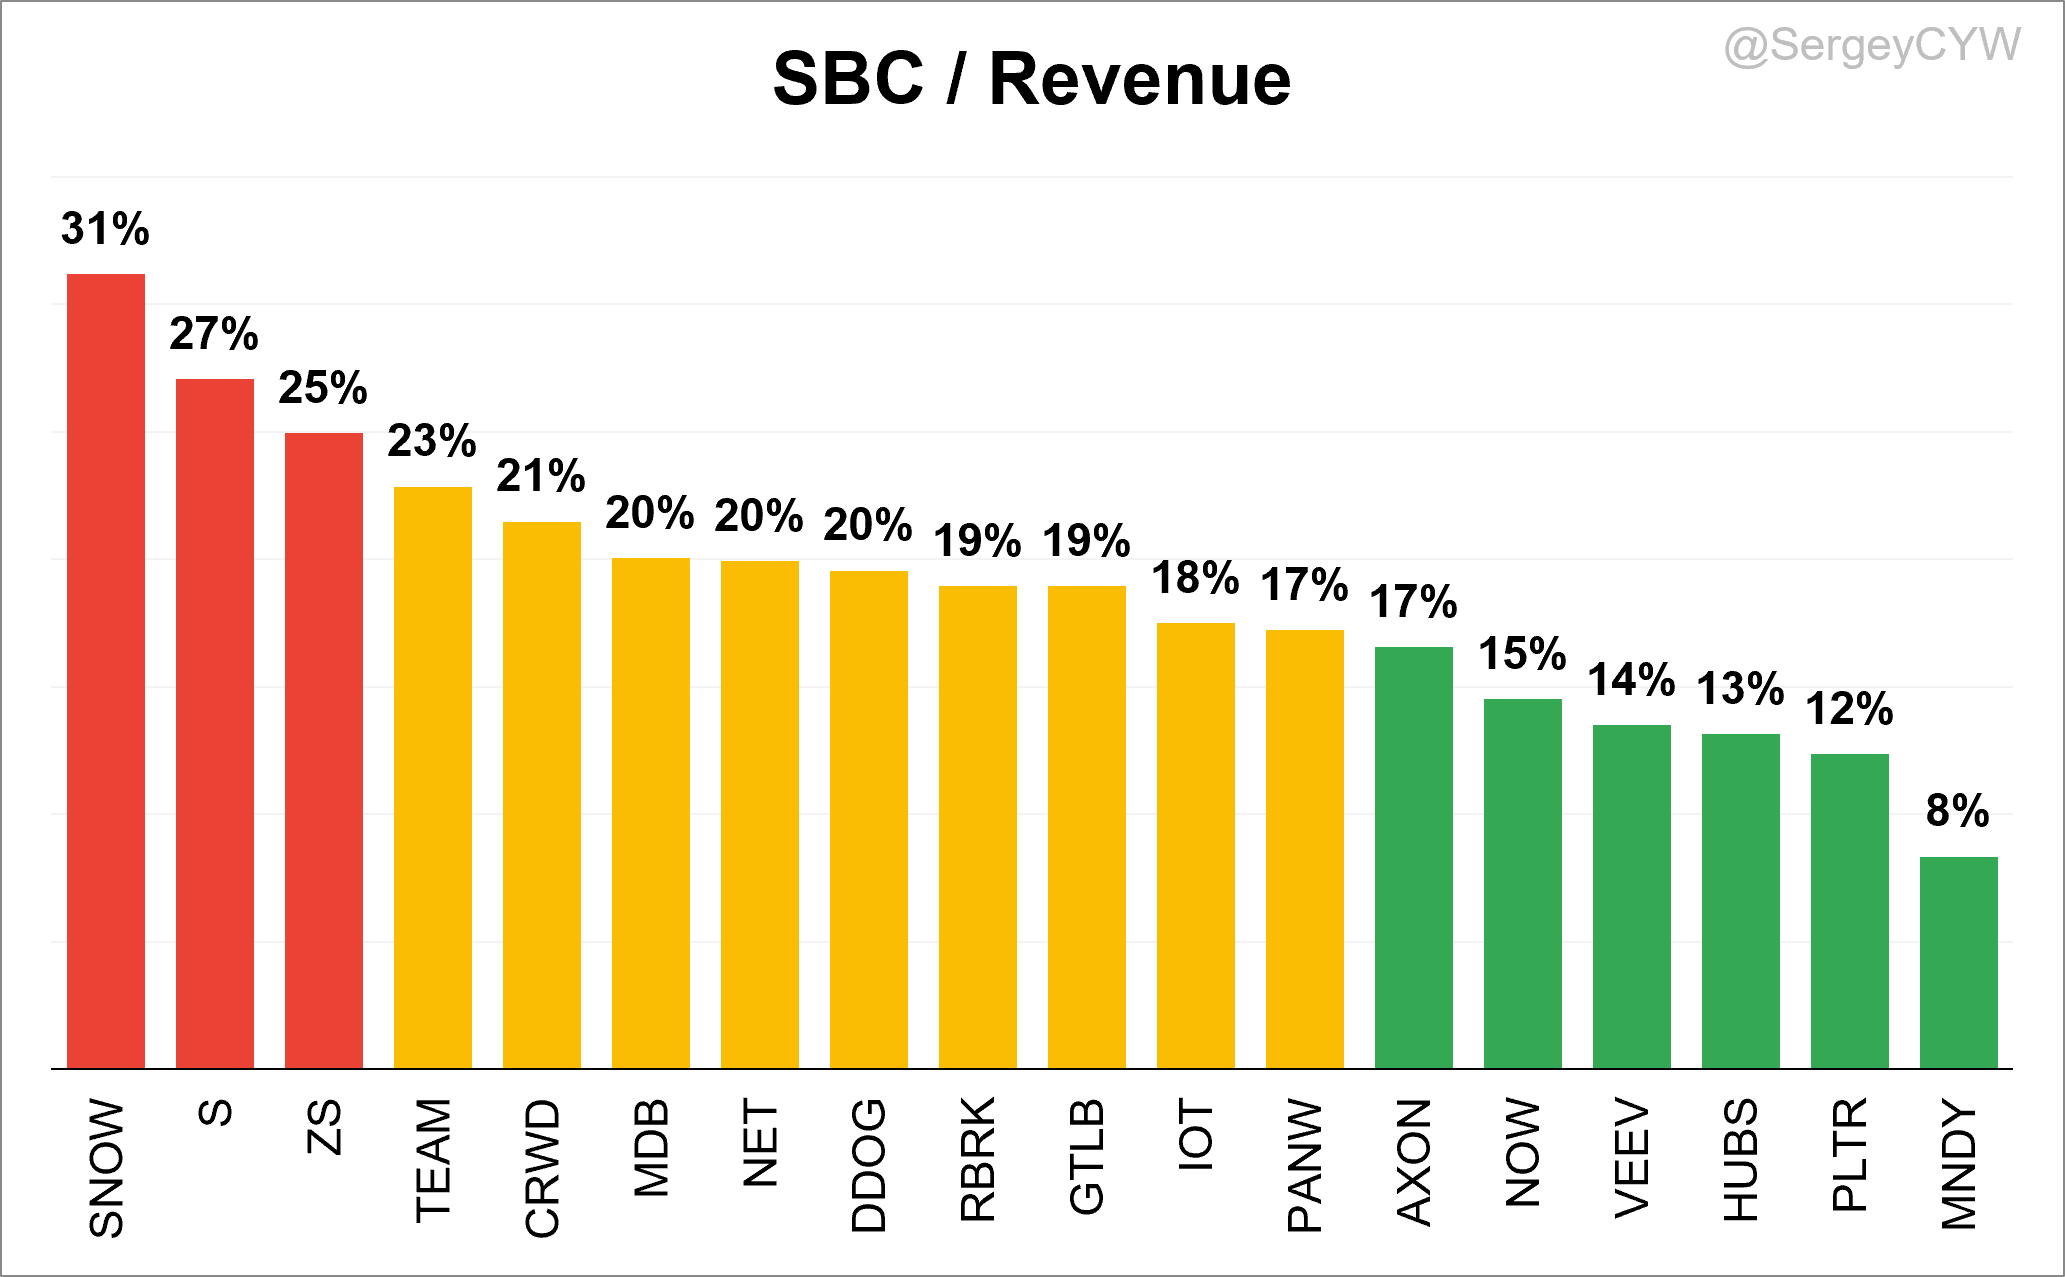
There are significant differences in SBC as a percentage of revenue across the industry.
For example, SNOW reports the highest SBC level at 31%, followed by S at 27% and ZS at 25%. While SNOW may justify higher SBC through strong and accelerating revenue growth of +33% YoY, SentinelOne’s revenue growth was +20.8% YoY and continues to decelerate, raising concerns about the sustainability of such a high compensation level. ZS’s elevated SBC level is also concerning given its slowing revenue growth, with Q1 revenue growth at +25% YoY.
Next are TEAM, CRWD, MDB, NET, and DDOG, all with elevated SBC levels above 20%.
Stocks such as AXON, NOW, VEEV, HUBS, PLTR, and MNDY report SBC levels below 17%, which reflects a more balanced approach between compensation and growth.
It is especially worth highlighting PLTR’s SBC level, which looks low given its +85% YoY revenue growth. AXON also significantly reduced SBC from 26% in the previous quarter to 17%.
Overall, most SaaS companies have meaningfully reduced their SBC levels over the past year.
PANW’s SBC level increased noticeably due to several large recent acquisitions.
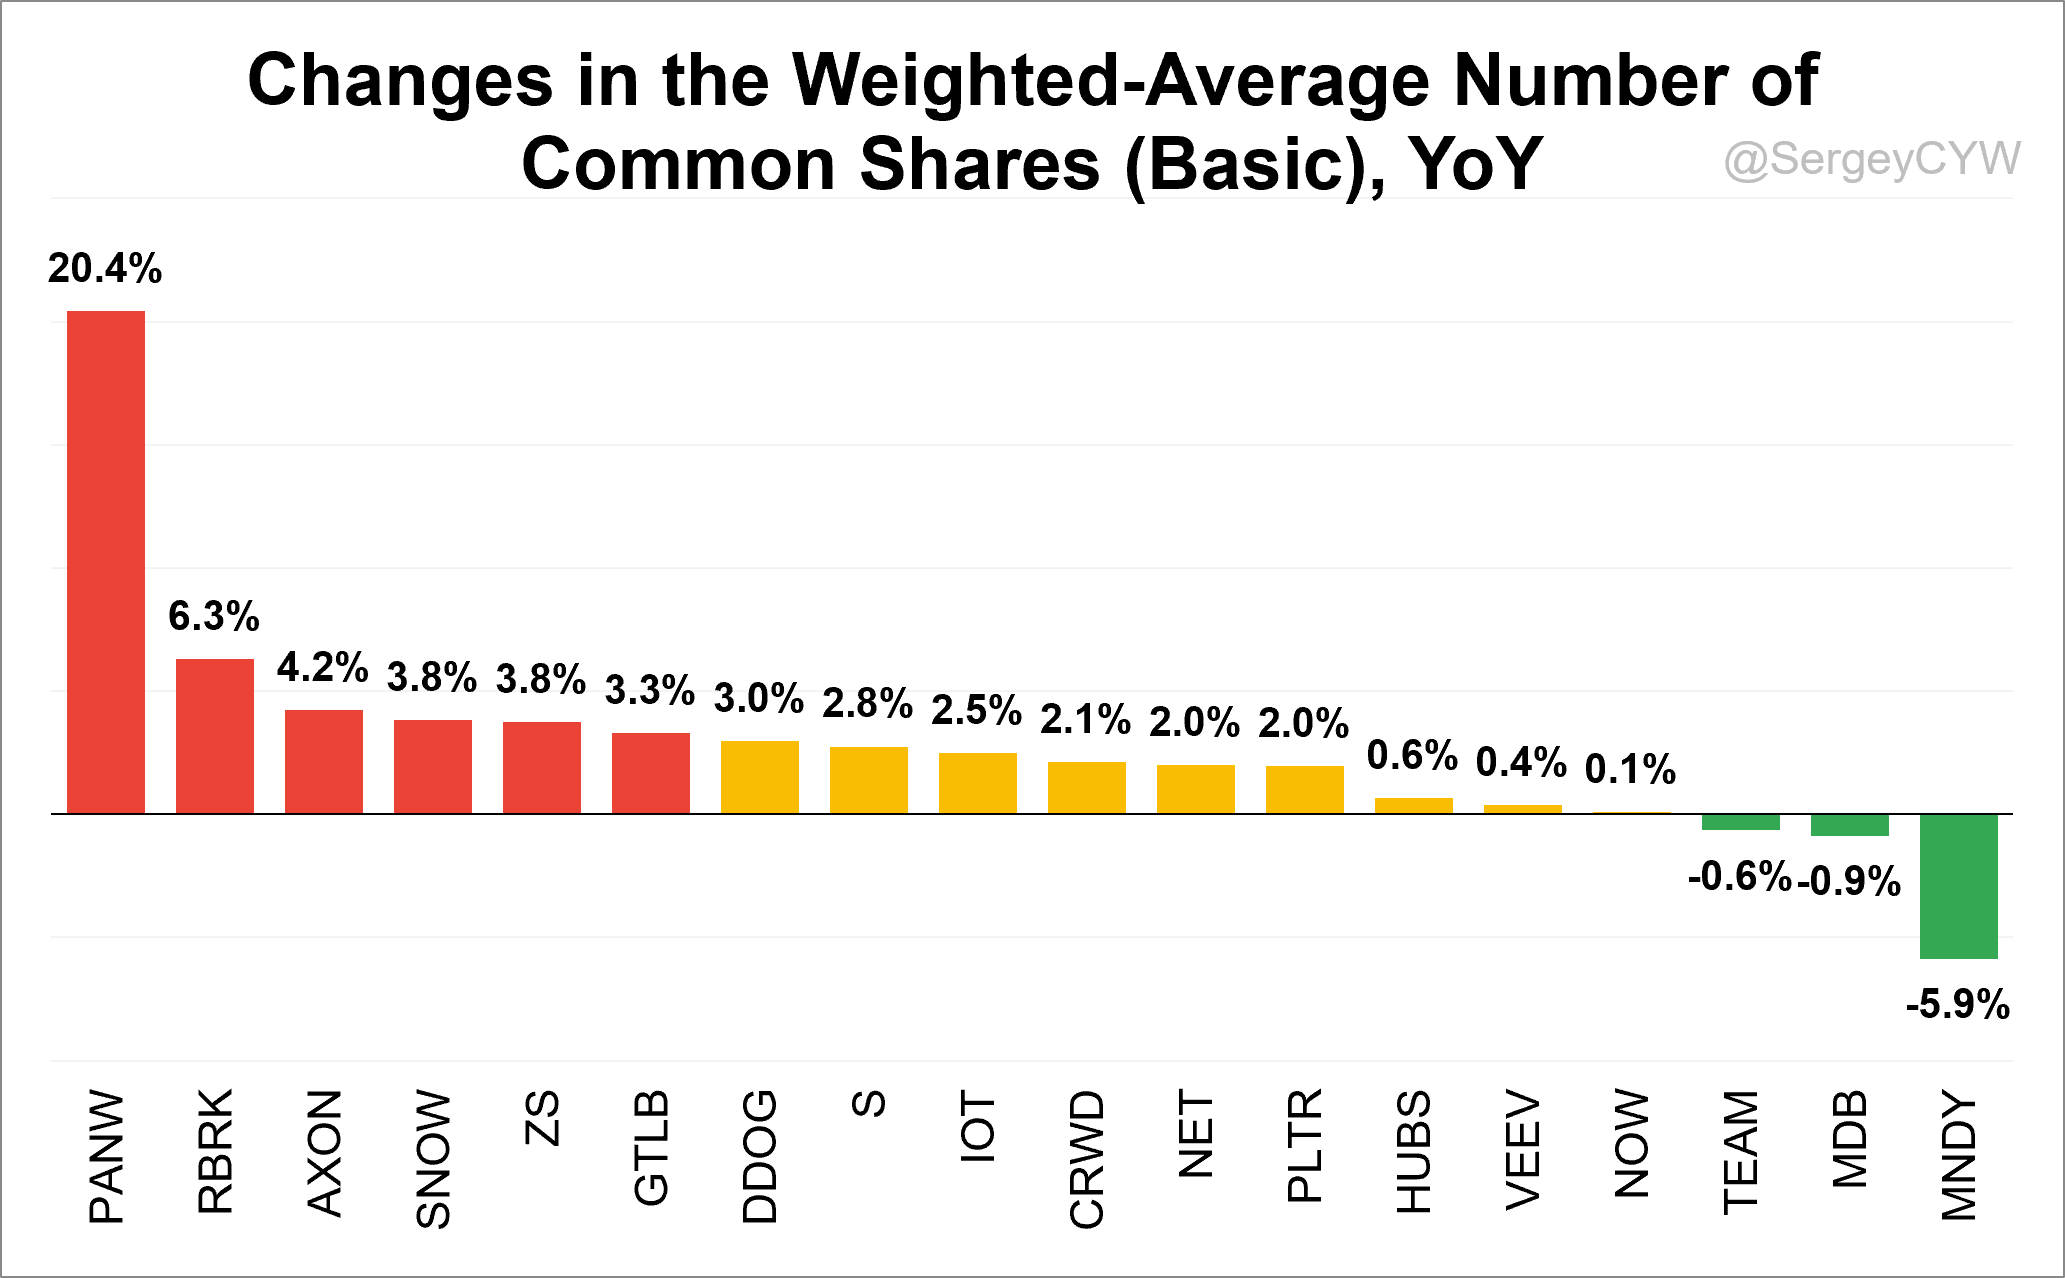
A crucial factor for shareholders is dilution. Let’s examine the changes in the Weighted-Average Number of Common Shares (Basic) over the last quarter.
The most significant dilution was reported by PANW, with the weighted-average number of shares increasing +20.4% YoY. This elevated level of dilution was driven by several large recent acquisitions.
It was followed by RBRK at +6.3%, AXON at +4.2%, and SNOW and ZS at +3.8%, levels of dilution that raise meaningful concerns for shareholders.
For high-growth companies, more reasonable levels of dilution were observed at DDOG, S, IOT, CRWD, NET, and PLTR, all ranging between 2.0% and 3.0%.
Companies that have kept dilution particularly well under control include HUBS at +0.6%, VEEV at +0.4%, and NOW at +0.1%.
Meanwhile, several companies actually reduced their share counts. TEAM decreased common shares by -0.6%, MDB by -0.9%, and MNDY by an impressive -5.9%, reflecting active share repurchase programs and shareholder-friendly capital allocation.
MDB allocated $100 million toward share repurchases in Q1. SNOW used approximately $300M to repurchase 1.7M shares during Q1. MNDY executed $553 million of share repurchases during Q1 and still had approximately $182 million remaining under its existing share repurchase authorization program. These buybacks helped offset dilution and demonstrate management’s confidence in the long-term value of their businesses.
Valuations: P/S, P/GP, P/OP, Rule of 40, and PSG
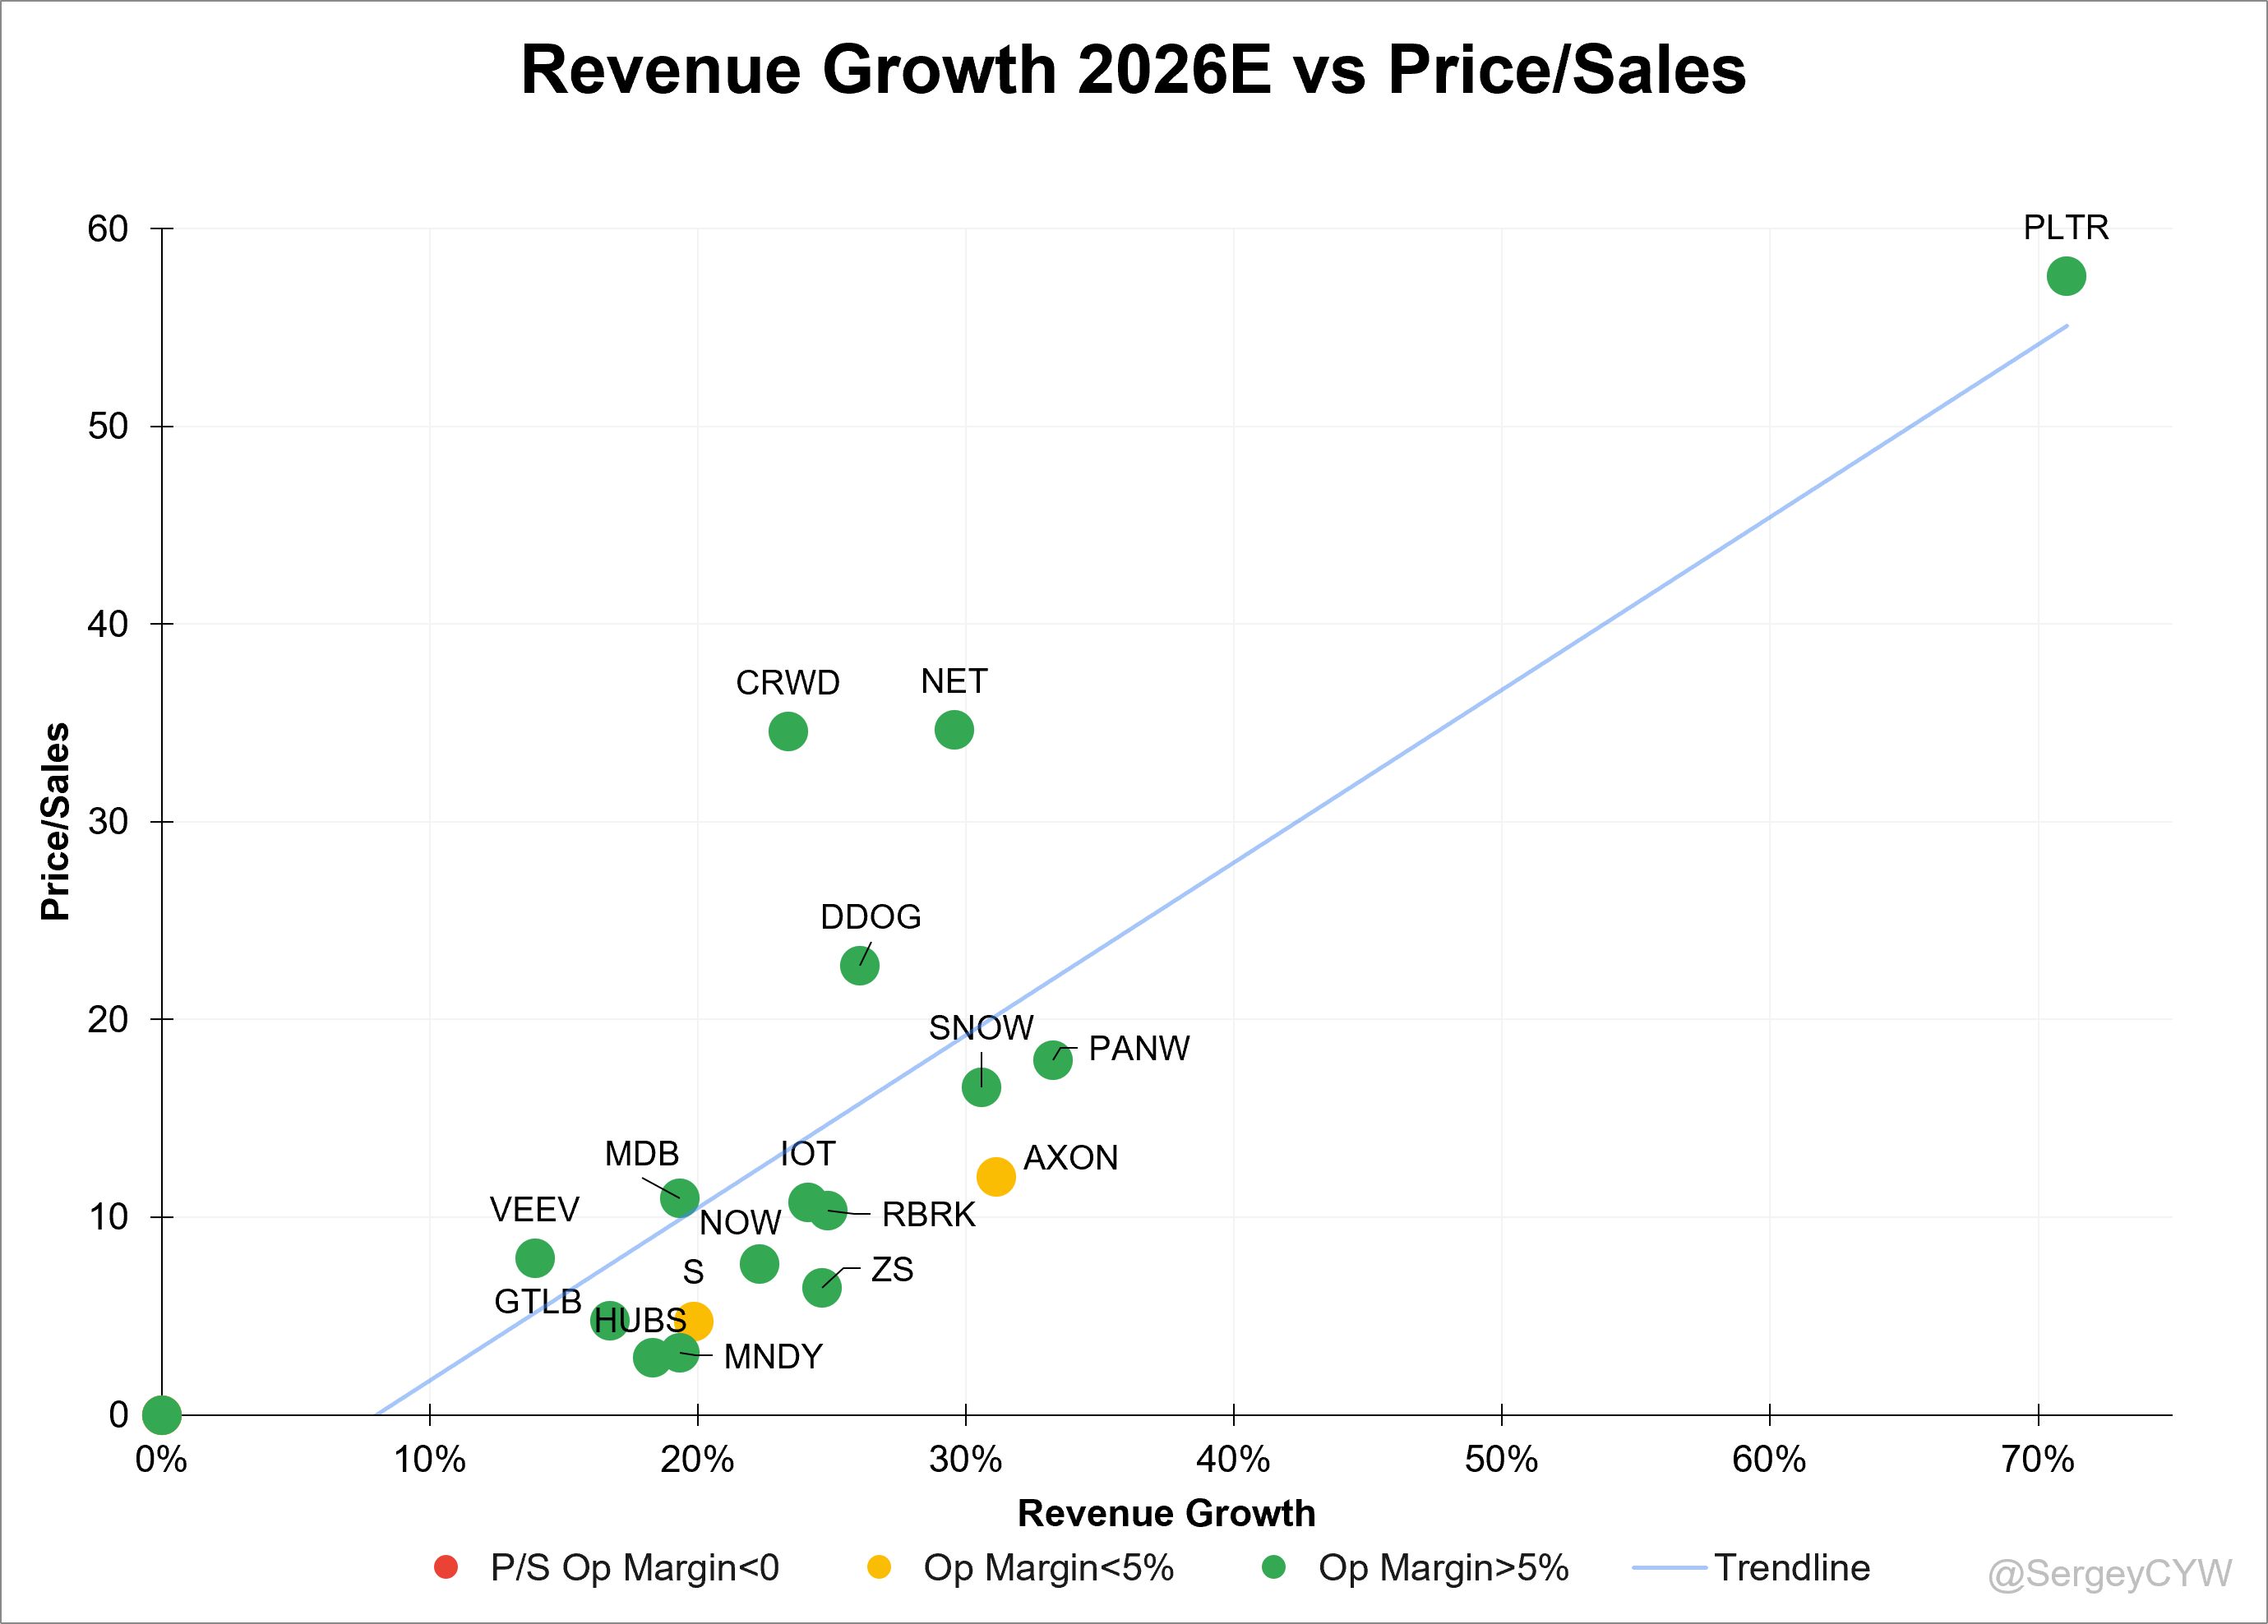
Finally, let’s examine company valuations by analyzing the Price/Sales Price/Gross Profit and Price/Operating Profit (Non-GAAP) multiple relative to projected revenue growth over FY 2026.
Let’s start with Price/Sales.
Evaluating growth stocks using forward projected revenue growth is crucial for investors because it provides insight into a company’s future potential rather than simply reflecting its current performance.
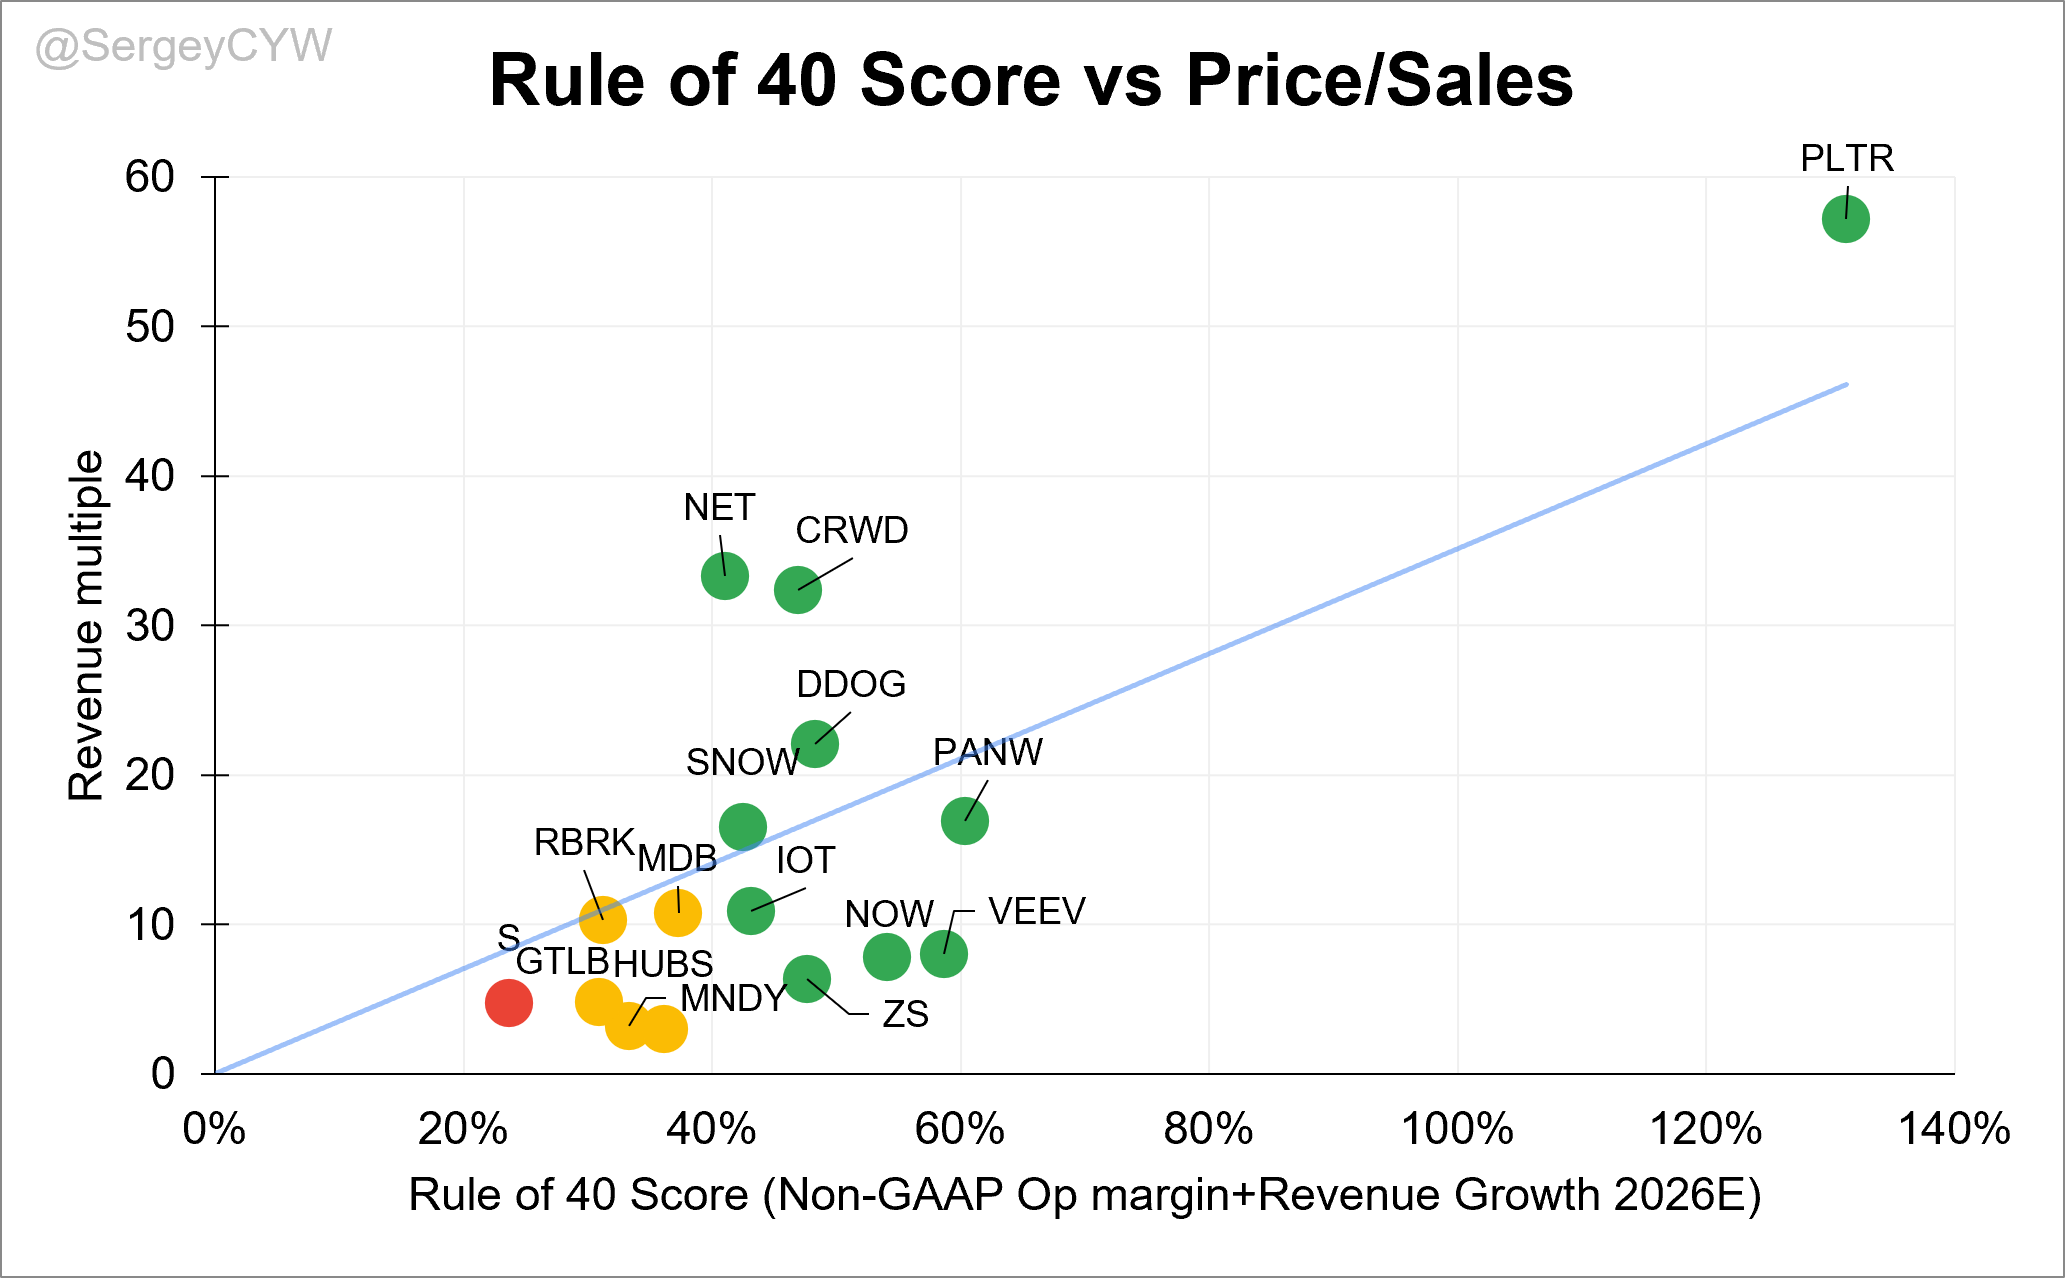
In the chart, companies with negative operating margins are marked in red, those with operating margins below 5% are marked in yellow, and companies with operating margins above 5% are shown in green.
Based on this framework, PLTR, NET, and CRWD are trading at a premium valuation relative to their projected growth rates.
Meanwhile, AXON, ZS, and MNDY appear undervalued based on their Price/Sales multiples relative to expected revenue growth.
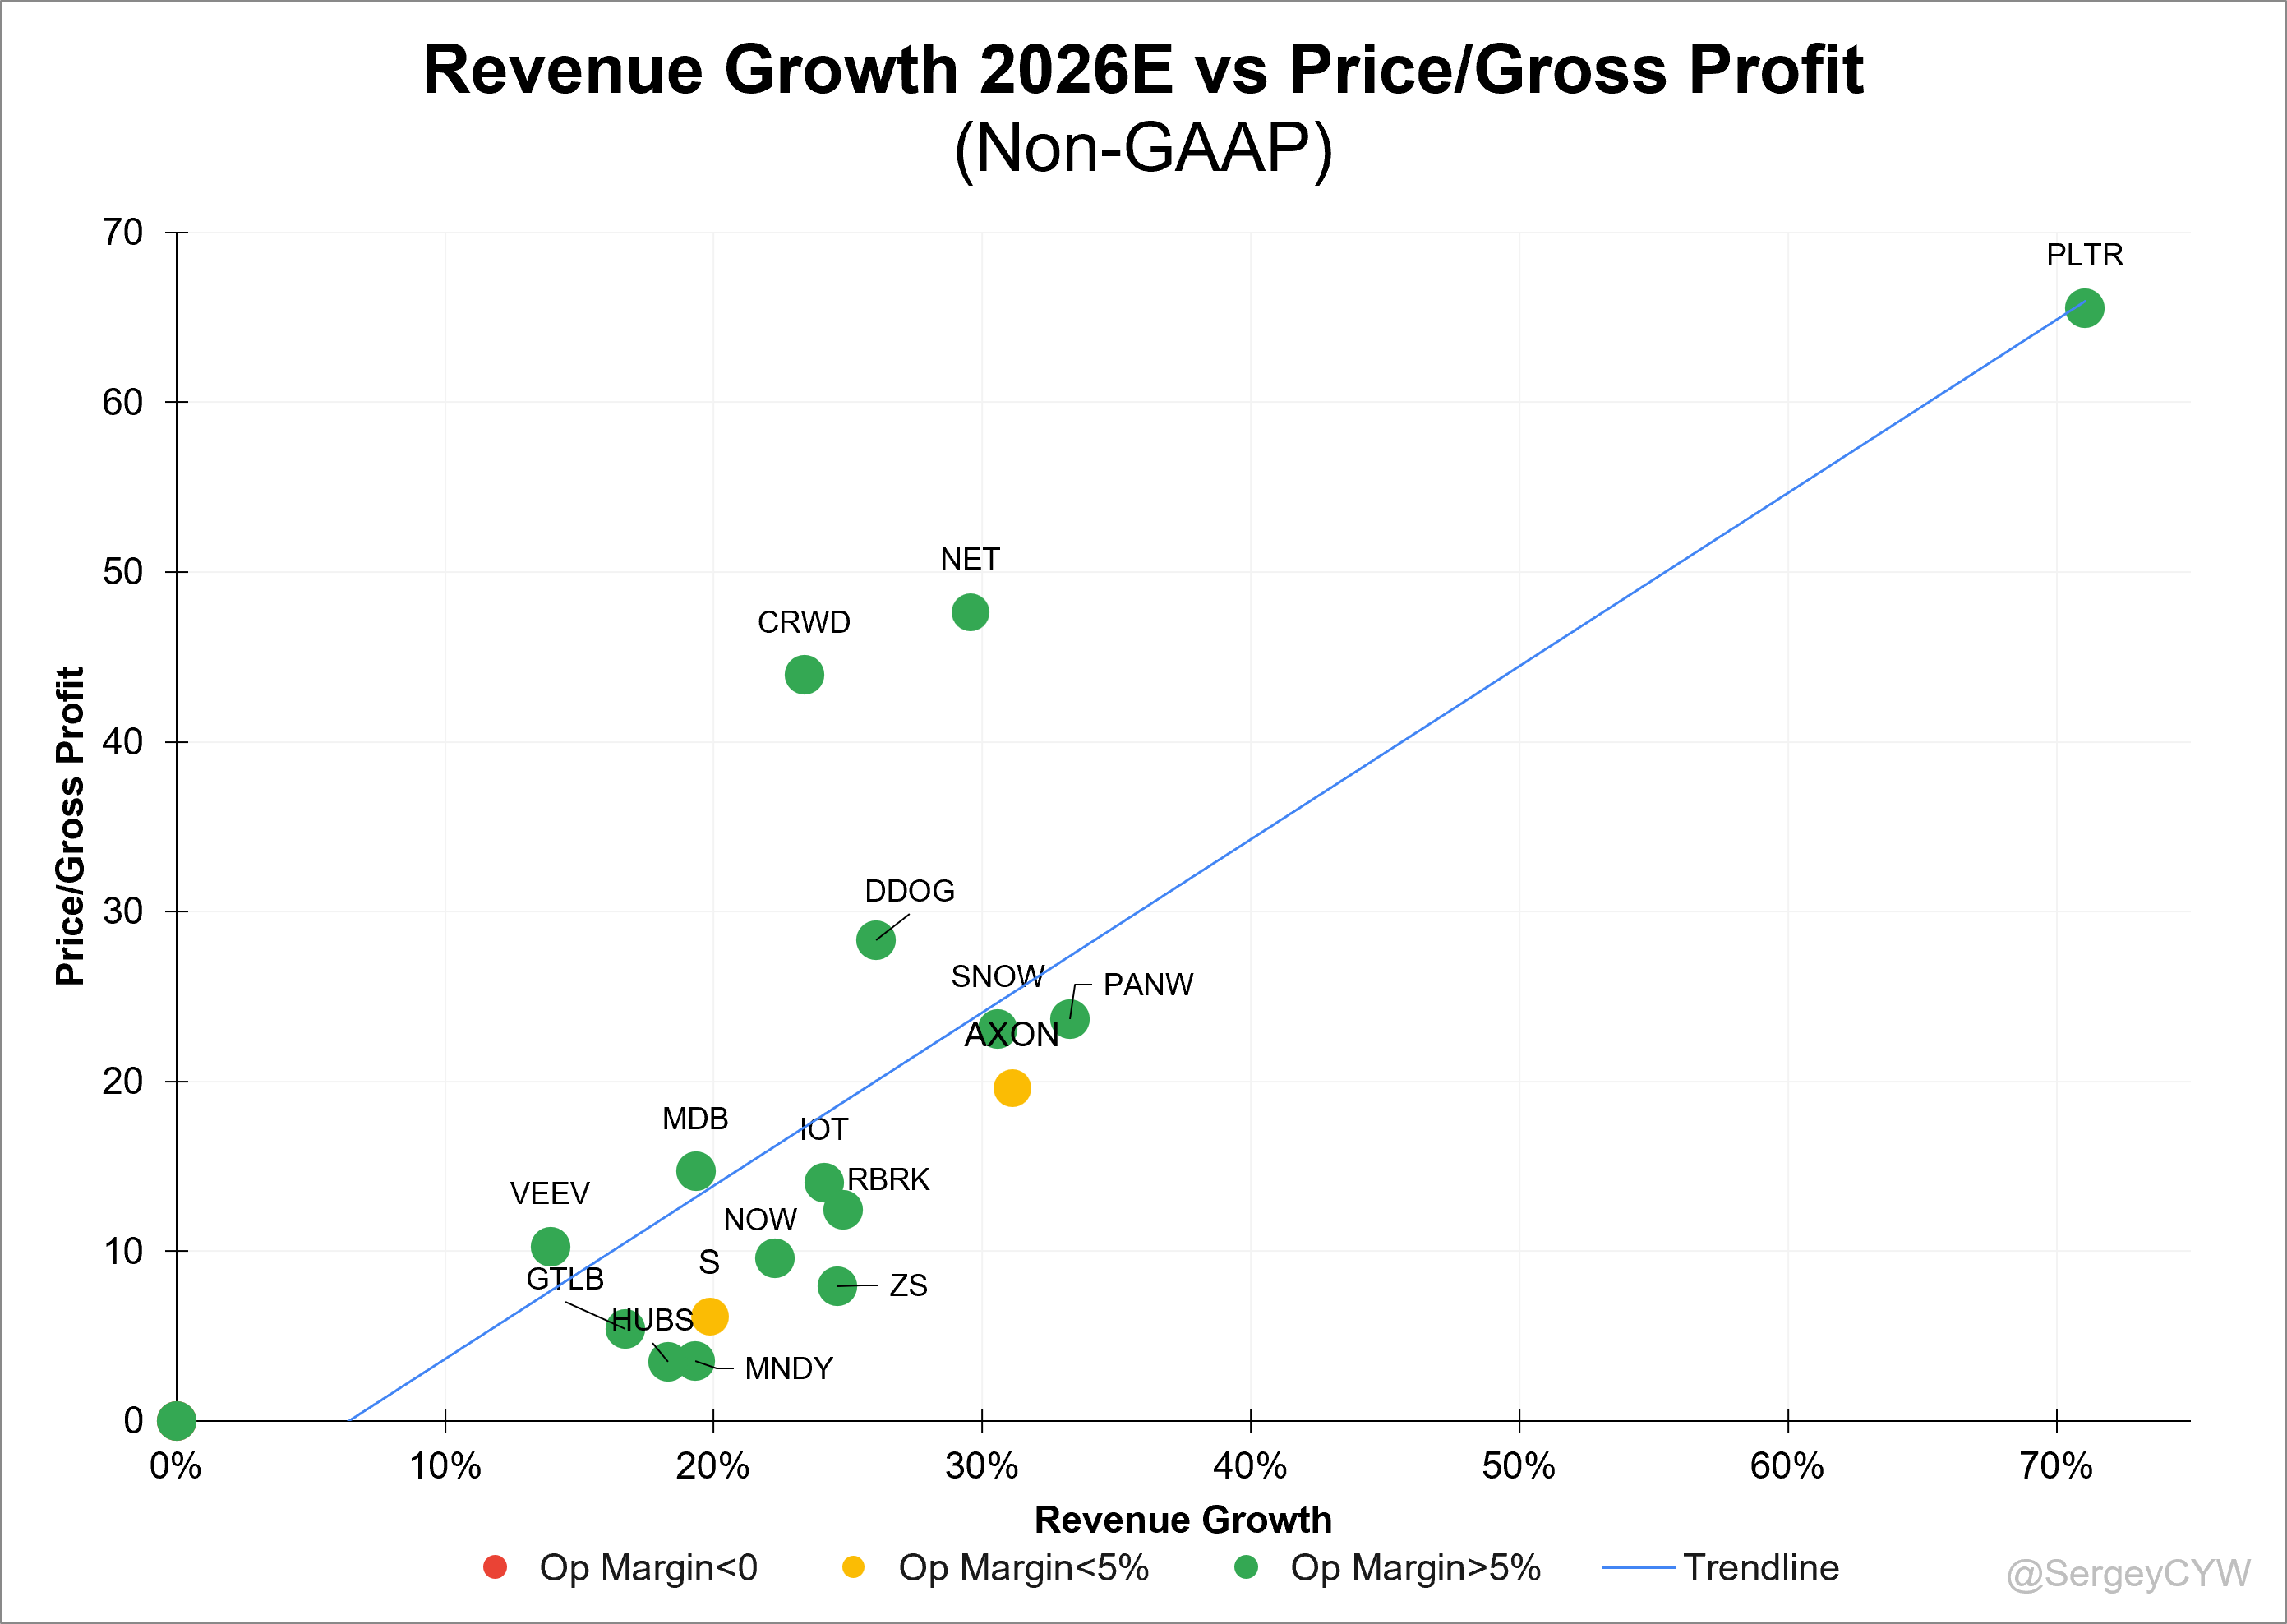
Now let’s look at Price/Gross Profit (Non-GAAP).
This multiple incorporates product efficiency through gross profit margin, which is one of the most important metrics for software companies. Consistently high or improving gross margins often indicate a strong competitive position, pricing power, scalable economics, and attractive long-term market potential. By adjusting for differences in gross margins, this valuation approach provides a more refined comparison between software companies than Price/Sales alone.
NET and CRWD trade at the highest premium valuations, while PLTR, despite having the highest multiple at 65.6x, is also expected by management to deliver +71.1% revenue growth, which partially supports its elevated valuation.
On the other hand, MNDY, ZS, and HUBS appear undervalued relative to their growth profiles and current market expectations.
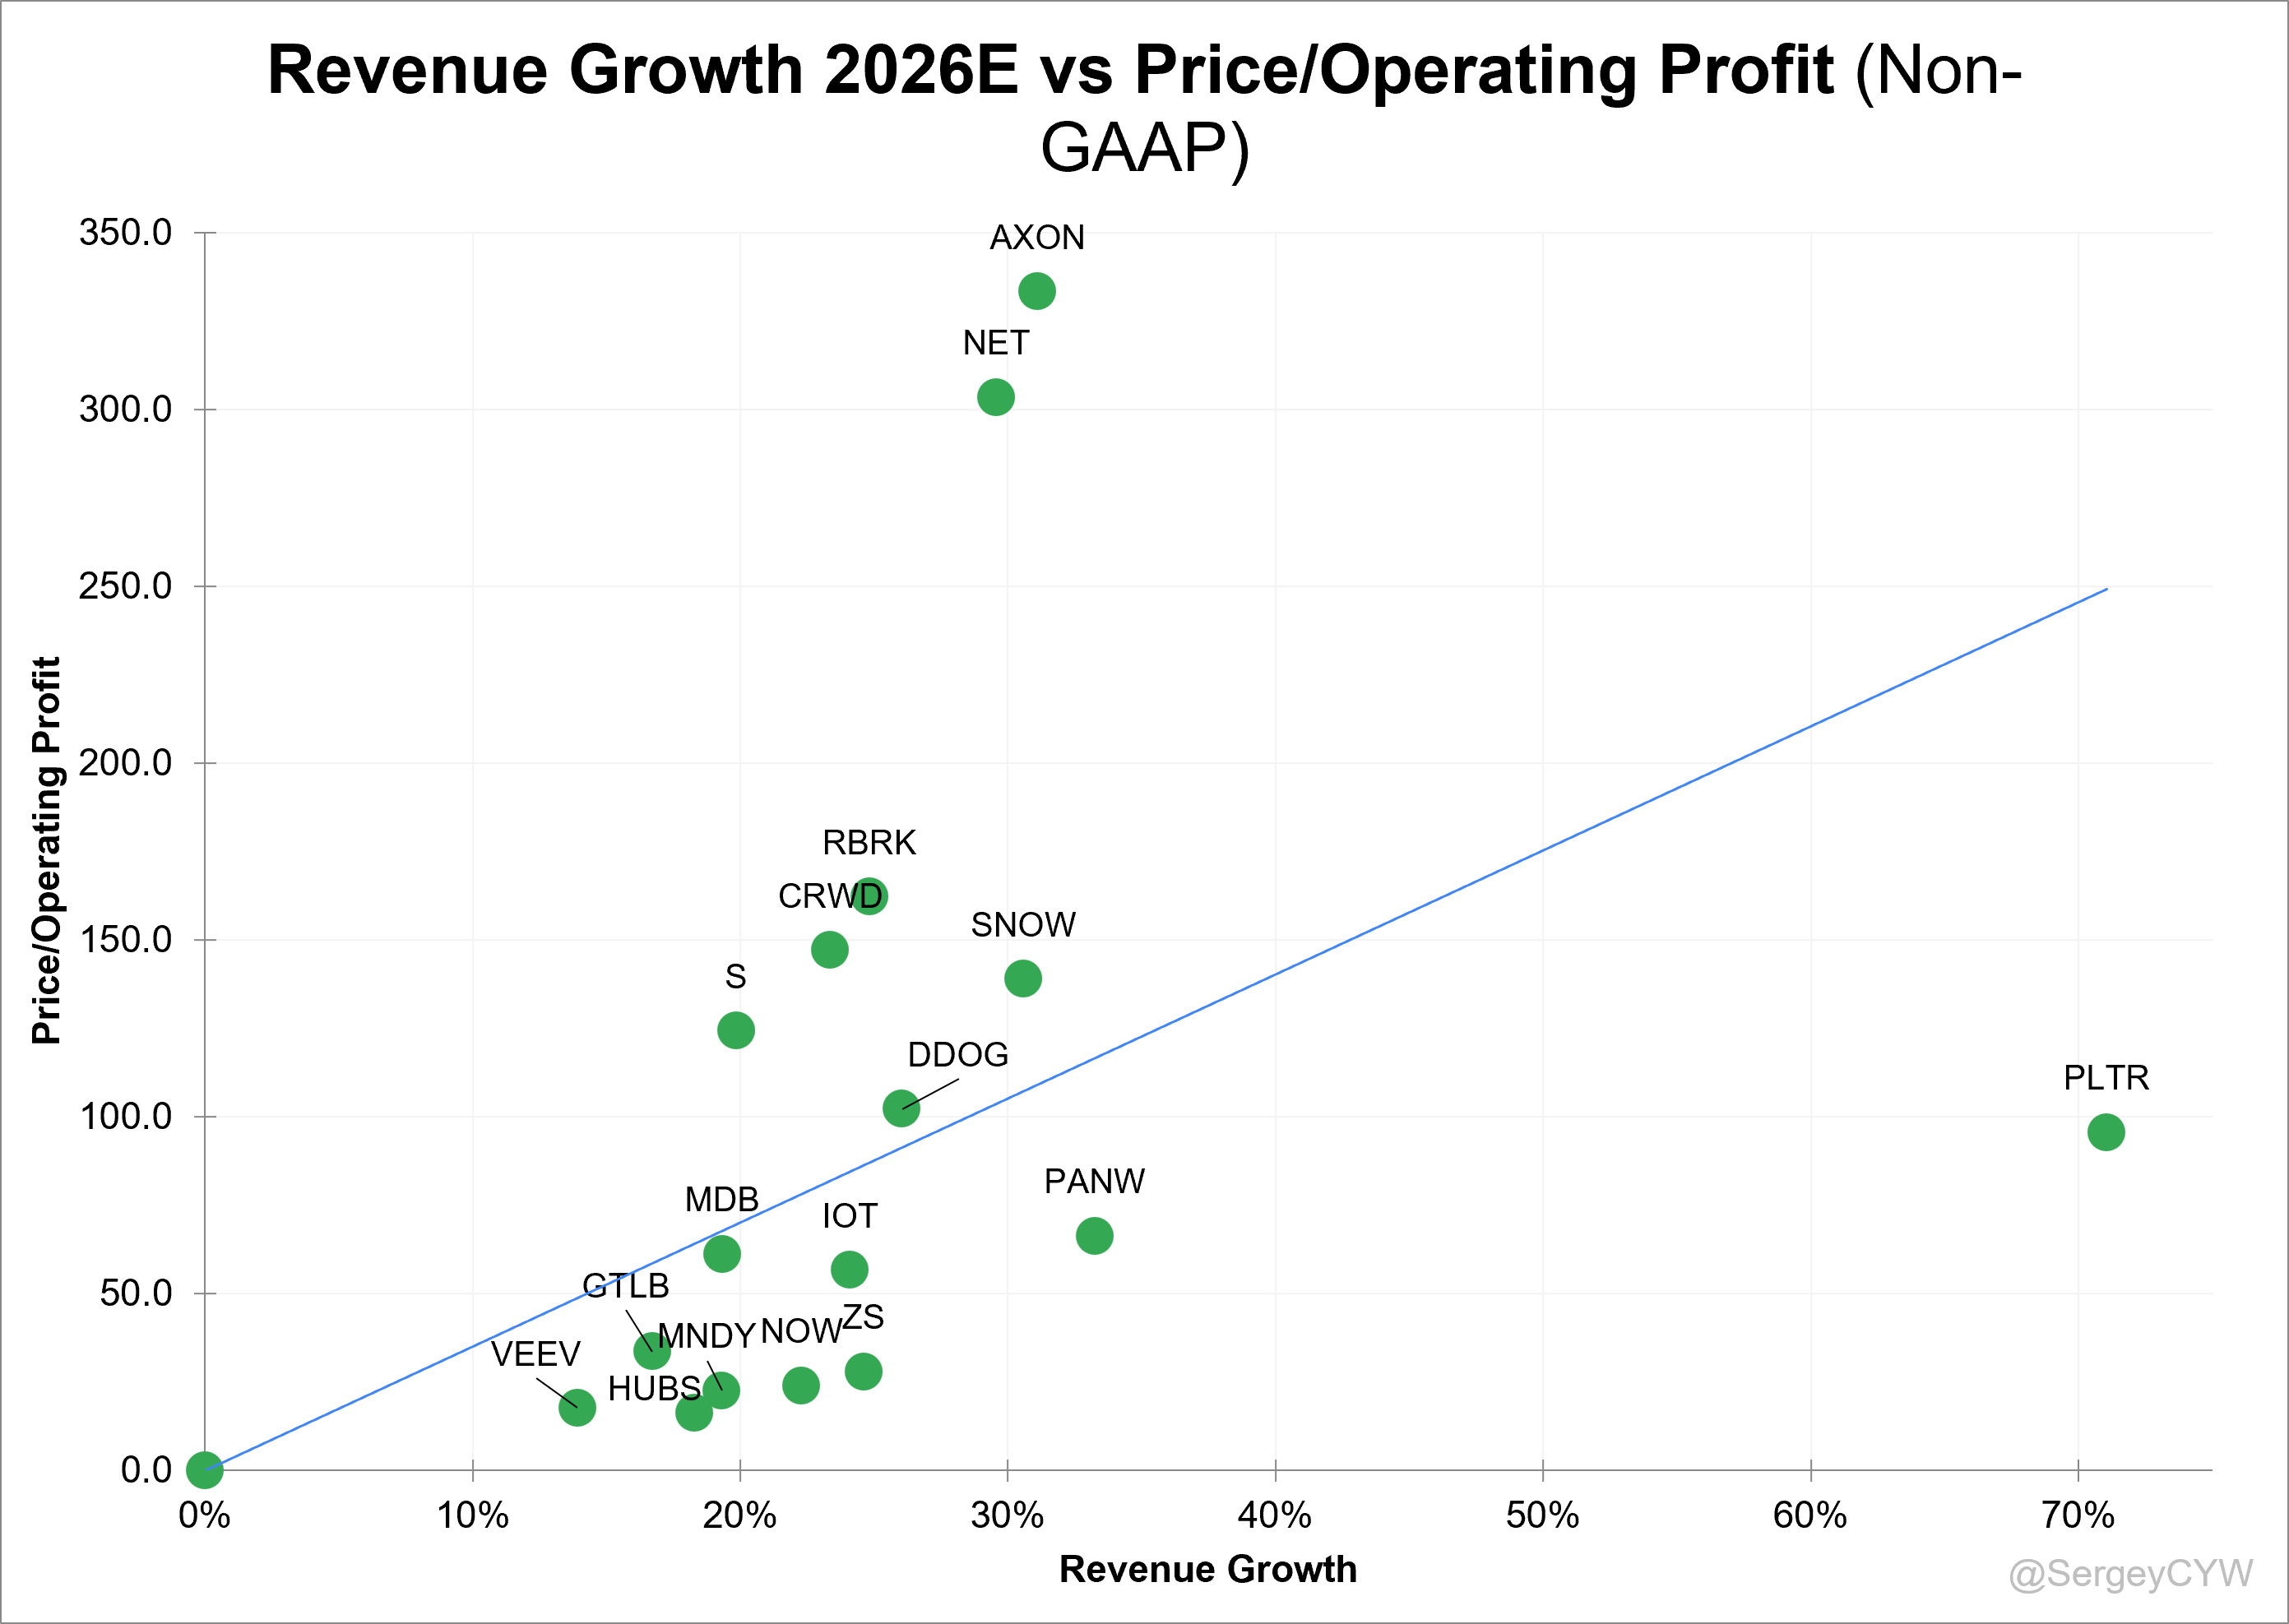
Price/Operating Profit (Non-GAAP) relative to projected revenue growth shows a slightly different picture.
Here, thanks to its high operating margin, PLTR looks undervalued relative to peers, while AXON and NET trade at a premium despite having lower operating margins.
Let’s consider the Rule of 40 as a framework for evaluating companies. The Rule of 40 is a key financial metric used to assess the performance of SaaS and other growth-oriented software companies. It balances revenue growth and profitability, offering a more holistic view of a company’s financial health. Companies that meet or exceed the 40% threshold are generally considered well-positioned, making them attractive to investors seeking a blend of growth and operating efficiency.
For this analysis, I used the non-GAAP operating margin from the most recent quarter, combined with full-year revenue growth estimates. While using quarterly operating margin can introduce some volatility due to seasonality, it also provides insight into companies that have recently achieved operating profitability.
The Rule of 40 is particularly useful for comparing companies across different growth stages and scales.
🟢 Rule of 40 Score > 40: IOT, SNOW, NET, ZS, DDOG, CRWD, VEEV, NOW, PANW, PLTR
🟠 Rule of 40 Score < 40: RBRK, MDB, MNDY, HUBS, GTLB
🔴 Rule of 40 Score < 25: S
When comparing Rule of 40 to Price/Sales (P/S) ratios, PLTR, NET, and CRWD appears overvalued, while ZS, NOW, and VEEV appear undervalued based on this metric.
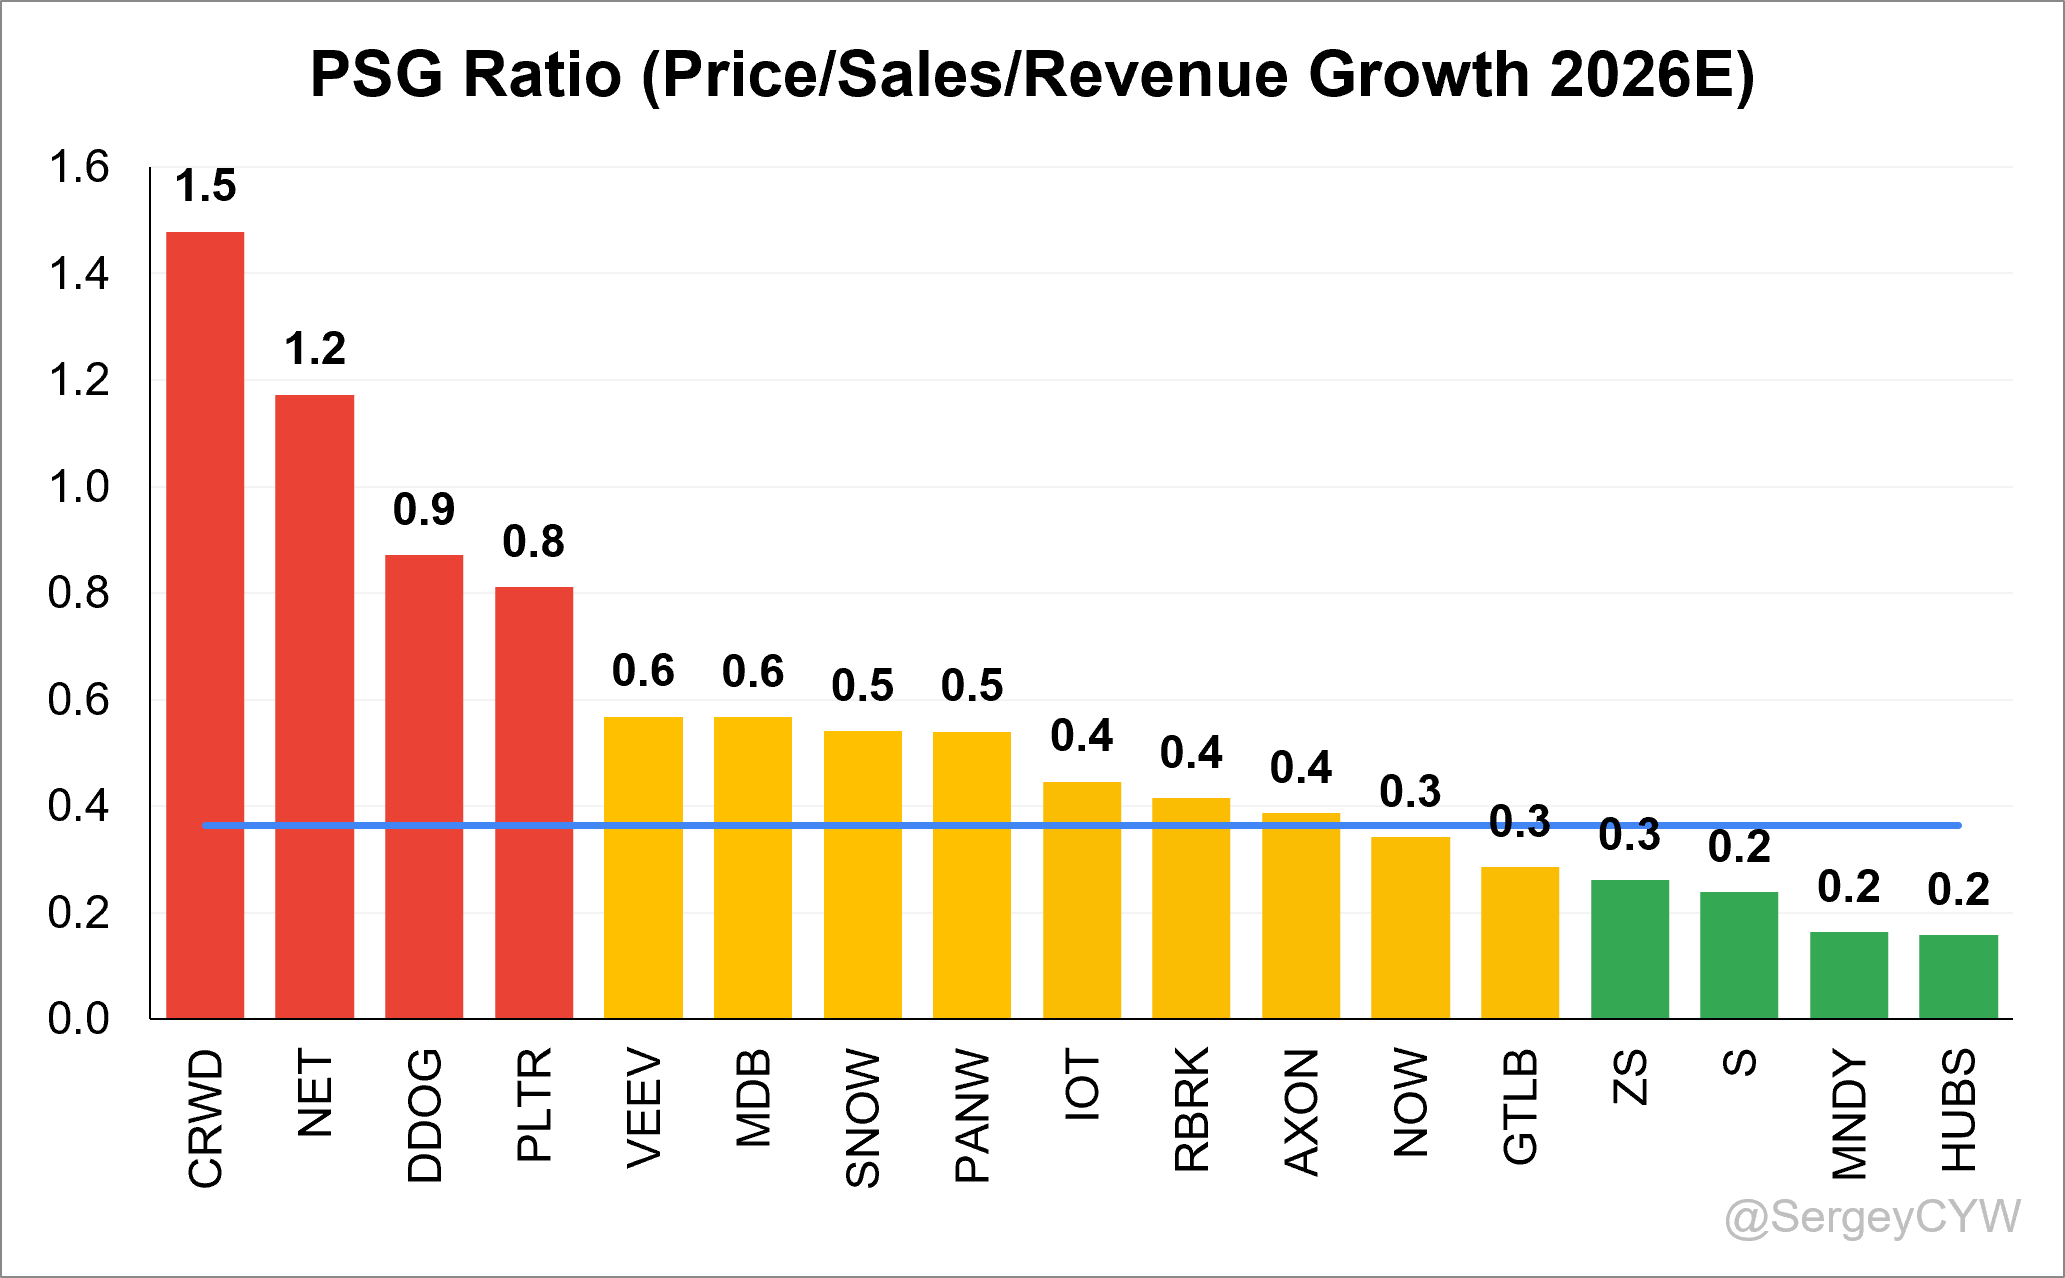
In conclusion, let’s consider the PSG (Price/Sales/Growth) metric. The PSG metric is a valuable valuation tool for evaluating software companies, as it offers a more nuanced perspective than the traditional Price-to-Sales (P/S) ratio by incorporating the company’s growth rate.
This metric is particularly relevant in the software industry, where companies often trade at high P/S multiples driven by expectations of rapid, scalable growth.
The PSG ratio helps determine whether a high P/S valuation is justified based on a company’s actual growth trajectory.
Companies trading with a PSG ratio below the median include HUBS, ZS, S, and MNDY.
Companies trading around the median PSG level include VEEV, MDB, SNOW, PANW, IOT, RBRK, AXON, NOW, and GTLB.
Companies trading with a PSG ratio above the median include PLTR, CRWD, DDOG, and NET.
Closing Thoughts
SaaS demand is not collapsing, on the contrary, several companies in the group showed accelerating revenue growth and improving profitability. Strong Q1 revenue beats and guidance raises suggest that management teams remain confident in the outlook for their businesses.
While the average metrics across the SaaS sector improved, SaaS is becoming increasingly selective.
On one side are companies with high retention, efficient growth, improving margins, controlled SBC, limited dilution, and reasonable valuations. Using this framework, PLTR remains the highest-quality operator, although its valuation continues to be debated. Meanwhile, DDOG, SNOW, MDB, IOT, and PANW stand out for their strong business quality and execution.
On the other hand, MNDY, ZS, and HUBS appear more attractive from a valuation perspective. However, concerns remain regarding execution, growth durability, and competitive positioning. As a result, their lower valuations may ultimately prove to be value traps if future growth fails to meet expectations or if competitive pressures intensify.
Thank you for reading!
Follow me for more frequent updates on X/Twitter and Threads, and on LinkedIn. For visual infographics, check out Instagram, and for portfolio changes, follow me on SavvyTrader.
Disclaimer: This earnings review is for informational purposes only and does not constitute financial, investment, or trading advice.
Despite the pullbacks, I still find SaaS valuation expensive, especially considering that their growth/business models could be less durable than previously expected.