

Q1 2025 SaaS Performance
Q1 2025 SaaS Deep Dive: Revenue Beats, DBNRR, CAC Payback, RDI Score, Margins, Valuation, SBC/Revenue, and Shareholder Dilution.

As Q1 2025 earnings season wraps up, investors and operators alike gain valuable insight into how leading SaaS companies are navigating today’s dynamic software landscape. From revenue beats to operational efficiency, product stickiness, customer acquisition dynamics, and valuation frameworks—there’s no shortage of signal in the noise.
This report examines a wide range of top SaaS names, including $CRWD, $PLTR, $AXON, $NET, $ZS, $S, $SNOW, $MDB, and $NOW, among others. Let’s explore the key metrics—Dollar-Based Net Retention Rate (DBNRR), Customer Acquisition Cost (CAC) Payback Period, Gross and Operating Margins, R&D Efficiency, Stock-Based Compensation (SBC), Dilution, and Valuation—that offer a comprehensive view into the underlying business quality and market positioning of these companies.
Revenue Surprises and Forecast Revisions
Revenue beats are a first layer of insight into execution. The clear outperformers in Q1 2025 were $IOT with a 4.2% revenue beat and $VEEV at 4.1%, signaling stronger-than-expected demand and operational execution. $SNOW and $MDB followed with solid 3.8% beats, reinforcing momentum. Other companies like $DDOG, $CFLT, $PLTR, $MNDY, $HUBS, $NET, and $ZS posted beats between 2.7% and 1.6%, a healthy signal despite tighter macro tailwinds.
On the conservative end, $CRWD missed by -0.3%, the only company to fall slightly short of its guidance. $PANW met expectations precisely, suggesting disciplined forecasting rather than slowing momentum.

When it comes to forward guidance, $PLTR led the field, raising its full-year forecast by 3.9%, a bullish signal from a company showing operating leverage and growing traction. $HUBS, $VEEV, $IOT, $DDOG, and $SNOW also revised upward by over 1%, while $MDB, $MNDY, and $ZS lifted their forecasts modestly. In contrast, $CFLT and $S lowered guidance, declining by 0.9% and 1.1% respectively—a cautionary note for investors.

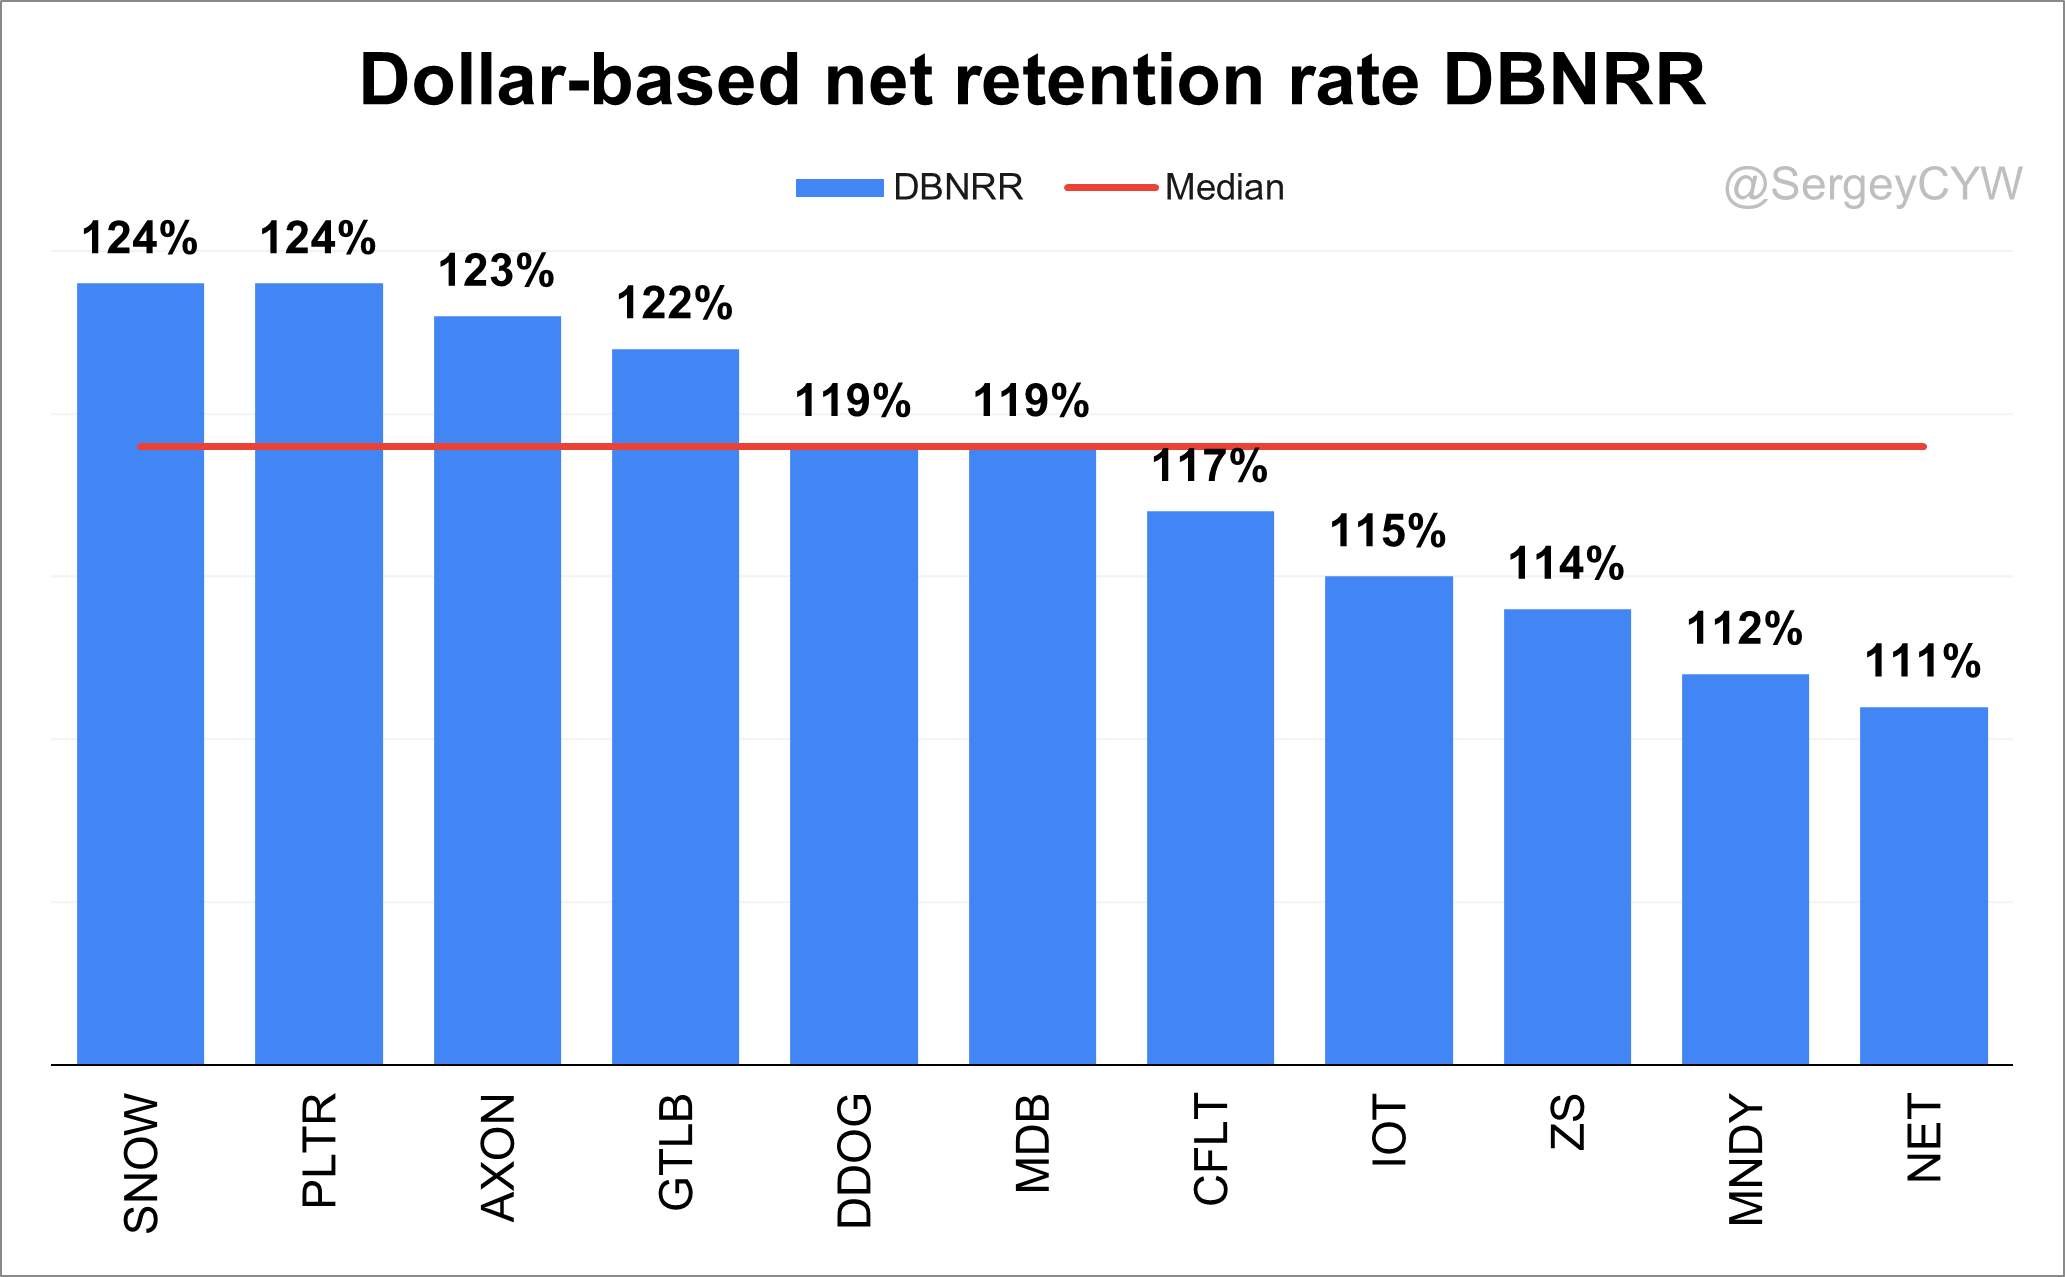
Retention Strength: Dollar-Based Net Retention Rate (DBNRR)
The Dollar-Based Net Retention Rate (DBNRR) remains one of the most powerful indicators of product stickiness and customer loyalty. It reflects the ability of a SaaS company to grow revenue from its existing customer base—via upsells, cross-sells, and expansion—while minimizing churn.
The median DBNRR rose to 119% in Q1 2025, up from 117% last quarter, signaling broad improvement across the sector. $SNOW and $PLTR led with 124%, showing strong expansion trends. $AXON followed closely at 123%, and $GTLB reported 122%, underscoring robust upsell motion.
Names sitting at the median level, like $DDOG and $MDB, maintained a stable 119%, while companies such as $CFLT (117%), $IOT (115%), and $ZS (114%) fell slightly below. Lower DBNRRs were reported by $MNDY at 112% and $NET at 111%, though for $MNDY, large and mid-sized customers exhibited stronger retention at 117%. $NET's figure was impacted by transitions in its "Pool of Funds" contract structure.
Product Focus vs. Go-to-Market Spend
One critical tradeoff in SaaS strategy involves R&D versus Sales & Marketing (S&M) spending. Companies with a product-led growth (PLG) strategy often lean heavily into R&D, using technology and UX superiority to drive organic growth, customer loyalty, and lower acquisition costs. Conversely, S&M-heavy models can scale quickly but often at the cost of efficiency and profitability.
$DDOG, $TEAM, and $VEEV allocate more to R&D than to S&M, illustrating a PLG tilt. This orientation often correlates with a durable competitive advantage and longer-term operating leverage, particularly when paired with strong retention metrics and customer expansion.
To understand how well these R&D investments translate into business outcomes, we turn to the R&D Index (RDI Score) and the CAC Payback Period.

Efficiency Check: CAC Payback Period
The Customer Acquisition Cost (CAC) Payback Period measures how quickly a company recoups its investment in acquiring a new customer. The shorter the period, the more efficient and scalable the company’s go-to-market engine.
In Q1 2025, efficiency varied dramatically. $VEEV (7.4 months), $PANW (8.2 months), $PLTR (12.2 months), and $TEAM (13.5 months) showcased elite efficiency. The median payback period rose to 26.9 months, up from 20.8 months in Q4 2024—a potential red flag if the trend persists.
At the far end of the spectrum, $MDB posted a shocking 1135.5-month payback, a seasonal distortion rather than a systemic issue. $HUBS (91.4), $GTLB (85.5), and $S (54.3) also saw stretched payback periods, calling into question the scalability of their current go-to-market structures.
Names sitting near the median—$NET, $MNDY, $ZS, $DDOG, $CRWD, $AXON, $IOT, $NOW, and $SNOW—appear to maintain balanced efficiency with room to optimize.

R&D Efficiency: The RDI Score
The R&D Index (RDI Score) highlights how effectively a company turns its R&D dollars into revenue growth. An RDI Score above 1.4 indicates that each $1 invested yields more than $1.40 in revenue growth—a benchmark of excellence.
In Q1 2025, $MDB posted a standout score of 2.9, showcasing exceptional R&D yield. $HUBS (1.9), $GTLB (1.8), $S (1.6), and $CFLT (1.6) also exceeded the high-performance threshold. $NET followed at 1.2, still above the median.
The median RDI Score among tracked companies was 1.1, a slight decline from 1.2 last quarter. $PANW posted a worrying 0.4, below industry norms, indicating inefficiency in innovation investment despite strong gross margins.

Margin Profiles: Gross and Operating Margins
Gross Margin is a core metric for evaluating the scalability of a SaaS company. Software businesses typically carry high margins, but variability exists depending on the revenue mix and business model.
$MNDY and $GTLB led with gross margins of 90%, exemplifying top-tier product scalability. $AXON posted 64% overall, but its Software & Services segment delivered 74%, reflecting an expanding software-driven mix.

Operating Margins offer insight into a company’s ability to translate growth into profitability. $PLTR reported the highest non-GAAP Operating Margin at 44%, followed by $NOW, $VEEV, $PANW, and $TEAM, ranging from 31% to 26%. On the other end, $S posted -2%, still in investment mode.
Both $IOT and $GTLB made meaningful progress toward profitability, swinging from negative margins in Q1 2023 to 14% and 12% positive margins respectively this quarter—clear signals of improving operational maturity.

Free Cash Flow Margin
Free Cash Flow (FCF) is an increasingly important metric in SaaS, especially in a capital-disciplined market. It reflects both profitability and cash efficiency.
$VEEV blew past expectations with an FCF margin of 115%, driven by one-time timing factors but still impressive. $GTLB (49%), $NOW (48%), $TEAM (47%), and $PLTR (42%) also demonstrated strong cash generation. Other healthy performers included $MNDY, $DDOG, $CRWD, and $PANW, each exceeding 24% FCF margin.
$MNDY’s 39% FCF margin paired with 30% YoY revenue growth stands out as one of the most balanced growth-efficiency profiles in the space.

Stock-Based Compensation (SBC) and Dilution
Stock-Based Compensation (SBC) is a double-edged sword. It aligns teams around long-term value creation but can also lead to dilution and pressure on earnings metrics.
$SNOW tops the list with SBC at 39% of revenue, followed by $CFLT (37%) and $S (30%). While high SBC might be justifiable in early-stage hypergrowth companies, it raises red flags when paired with slowing growth—as seen with $CFLT and $S.
In the 24–26% range, $GTLB, $TEAM, $ZS, and $MDB show elevated but manageable levels. More balanced usage appears in $AXON, $CRWD, $IOT, $NET, $DDOG, and $PLTR, each around 20%.
Low-SBC leaders include $MNDY (11%), $VEEV and $NOW (15%), and $PANW (16%), showing how high-quality growth can be achieved with minimal dilution risk.
On dilution itself, $MDB (+11.1%) and $CFLT (+6.9%) posted the most significant increases in diluted shares. $PLTR and $S followed closely with over 6% dilution, raising investor concerns. More controlled dilution was found at $PANW, $HUBS, $CRWD, $NET, and $AXON (2–3%), while $NOW, $VEEV, and $TEAM kept dilution impressively low at 0.9%, 0.8%, and 0.3%, respectively. $SNOW even reduced its share count by 0.3% through repurchases.

Valuation and Operating Performance
To tie it all together, valuation multiples must be considered in light of margins and growth. The Price/Gross Profit (non-GAAP) multiple gives a cleaner picture than pure P/S by incorporating product profitability.
Companies with high valuations and strong margins—$PLTR, $VEEV, and $CRWD—are priced for quality. Those with lower valuations but positive margins—$GTLB, $MNDY, $SNOW, and $ZS—may offer more upside if growth persists. $S trades cheaply but still struggles with negative margins, making its undervaluation less compelling until execution improves.

The Rule of 40 as a Performance Filter
The Rule of 40, combining revenue growth and non-GAAP operating margin, serves as a foundational lens for SaaS health. Companies above 40% are generally viewed as executing well on both growth and efficiency.
In Q1 2025, $MNDY, $DDOG, $VEEV, $ZS, $PANW, and $PLTR met or exceeded the Rule of 40 threshold. Others like $HUBS, $SNOW, $IOT, $NET, $MDB, $S, and $CFLT fell short, either due to margin weakness or slowing growth. Based on Rule of 40 versus P/S ratios, $PLTR appears overvalued, while $PANW, $ZS, and $VEEV may be undervalued relative to their fundamentals.

Final Lens: PSG Ratio
To round out the valuation picture, the Price/Sales/Growth (PSG) ratio provides a more holistic view by factoring in growth rates.
$S trades below the median PSG, a reflection of discounted valuation amidst uncertain execution. Names around the median include $DDOG, $PANW, $MDB, $SNOW, $ZS, $MNDY, $CFLT, and $GTLB, suggesting fair value. Meanwhile, $PLTR, $VEEV, $CRWD, $NET, $HUBS, $IOT, $AXON, and $NOW trade at a premium, implying high expectations built into their stock prices.

Conclusion
Q1 2025 delivered a clear message across the SaaS landscape: operational discipline and product-led execution are driving the strongest performance.
Companies like $PLTR, $VEEV, $MNDY, $DDOG, and $NOW continue to combine solid revenue growth with improving margins and efficient capital allocation. High DBNRRs, strong free cash flow, and reasonable SBC levels are consistent traits among the leaders. Several names also improved their Rule of 40 scores, indicating a favorable balance between growth and profitability.
On the other hand, some companies—notably $S, $CFLT, and $MDB—face meaningful challenges, from inefficient customer acquisition and elevated dilution to questions around R&D return and valuation sustainability.
As always, valuation matters—but only in context. Metrics like Price/Gross Profit and PSG ratios are helping to separate premium-quality software businesses from those still searching for profitable growth.
Thank you for reading!
Follow me for more frequent updates on X/Twitter and Threads, and on LinkedIn. For visual infographics, check out Instagram, and for portfolio changes, follow me on SavvyTrader.
Disclaimer: This earnings review is for informational purposes only and does not constitute financial, investment, or trading advice.
Very nicely done, Sergey. But with this conclusion do you think it will be necessary to rebalance your portfolio or even sell the "losers" ?