
Palo Alto Networks: Platformization Pays Off — But Are Declining Gross Margins a Red Flag?
Deep Dive into $PANW: Valuation, Segment Growth, Key Metrics, Profitability, Expenses, Product Launches, Customer Acquisition, Financial Stability, SBC/Revenue, and Shareholder Dilution.

Palo Alto Networks is hitting a new stride. Revenue growth has re-accelerated to +15.8% YoY, signaling a clear rebound from the mid-2024 slowdown. The company’s bold platformization strategy—offering select products free short-term to secure long-term lock-in—is gaining traction, fueling record net new ARR and RPO growth of +24%, outpacing revenue. With only ~4% market share in a $110B cybersecurity TAM growing at +14% CAGR, the runway remains vast. Its economic moat—built on scale, network effects, and high switching costs—anchors sustained competitive advantage. Yet, while operating and FCF margins are expanding, and CAC payback improved to just 5.5 months, one question looms: can the company sustain this momentum amid declining gross margins and premium valuations near all-time highs?
Table of Contents:
1. Company Overview – A brief summary of the company, including its mission, sector, competitive advantage, and total addressable market (TAM).
2. Valuation – Analysis of changes in Forward EV/Sales and Forward P/E multiples, along with comparisons to peers within the same sector.
3. Economic Moat – Evaluation of the company’s moat across five key types: Economies of Scale, Network Effect, Brand, Intellectual Property, and Switching Costs.
4. Revenue Growth – Review of revenue growth dynamics over the past two years.
5. Segments and Main Products – Overview of the company’s business segments, latest quarterly performance by segment, product innovation, and revenue growth by region.
6. Market Leadership – Assessment of the company’s leadership status in its segment, as recognized by reputable rating agencies like Gartner, The Forrester Wave, etc.
7. Customers – Analysis of customer growth trends, customer success stories, and major customer wins.
8. Key Performance Indicators (KPIs) – Review of ARR growth, net new ARR, CAC payback period, RDI score, profitability, operating expenses, balance sheet strength, and shareholder dilution.
9. Conclusion – Final thoughts and summary based on the above analysis.
1. Company overview
About Palo Alto
Palo Alto Networks is a global cybersecurity leader founded in 2005. The company provides advanced firewalls and cloud-based offerings that extend those firewalls to cover various aspects of security. PANW serves over 85,000 organizations in over 150 countries, including 85% of the Fortune 100.
Mission
PANW’s mission is to prevent successful cyberattacks and enable digital transformation for global organizations. The company focuses on continuous innovation in cloud security, AI-powered threat prevention, and zero trust architecture to achieve this goal.
Sector
PANW operates in the cybersecurity sector, specifically in network security, cloud security, and security operations. The company competes in three main markets: network security (Strata & Prisma SASE), cloud security (Prisma Cloud), and security operations (Cortex).
Competitive Advantage
PANW’s competitive advantage lies in its unified control plane across hardware and software, and broad coverage of network, security operations center, applications, and cloud. The company’s App-ID technology provides greater visibility into application communication on networks, offering a level of control competitors struggle to match. PANW’s understanding of containerization allows its Next-Generation Firewall to be deployed physically, virtually, in a container, or via cloud, providing additional edge.
Total Addressable Market (TAM)
Palo Alto Networks estimates its TAM at $110 billion, presenting a significant expansion opportunity across its core security platforms.
In Network Security, the Strata platform addresses a market growing at a 9% CAGR from 2021 to 2024. Within this, software firewalls are expanding at a faster 13% CAGR, while the SASE (Secure Access Service Edge) segment leads with 36% CAGR—a clear signal of shifting enterprise priorities.
Prisma Cloud, the company’s cloud security platform, competes in a market valued at $10 billion in 2021 and projected to grow at a 30% CAGR through 2024. Demand is driven by the accelerating pace of cloud migration and the need for scalable, cloud-native security.
In Security Operations, Cortex targets the SIEM market, estimated at $40 billion. The segment is expected to undergo substantial transformation over the next 3–5 years, as legacy systems give way to AI-enhanced platforms and real-time analytics.
Overall, Palo Alto Networks addresses a cybersecurity market growing at a 14% CAGR, fueled by three critical forces: increased adoption of AI-driven security, a surge in cloud-first strategies, and enterprise demand for platform consolidation. The widespread shift to Zero Trust architectures further amplifies the need for integrated, end-to-end security coverage.
2. Valuation
$PANW Palo Alto is trading at a Forward EV/Sales multiple of 13.3, above the median of 7.2. The company’s Forward EV/Sales multiple is near its historical highs.
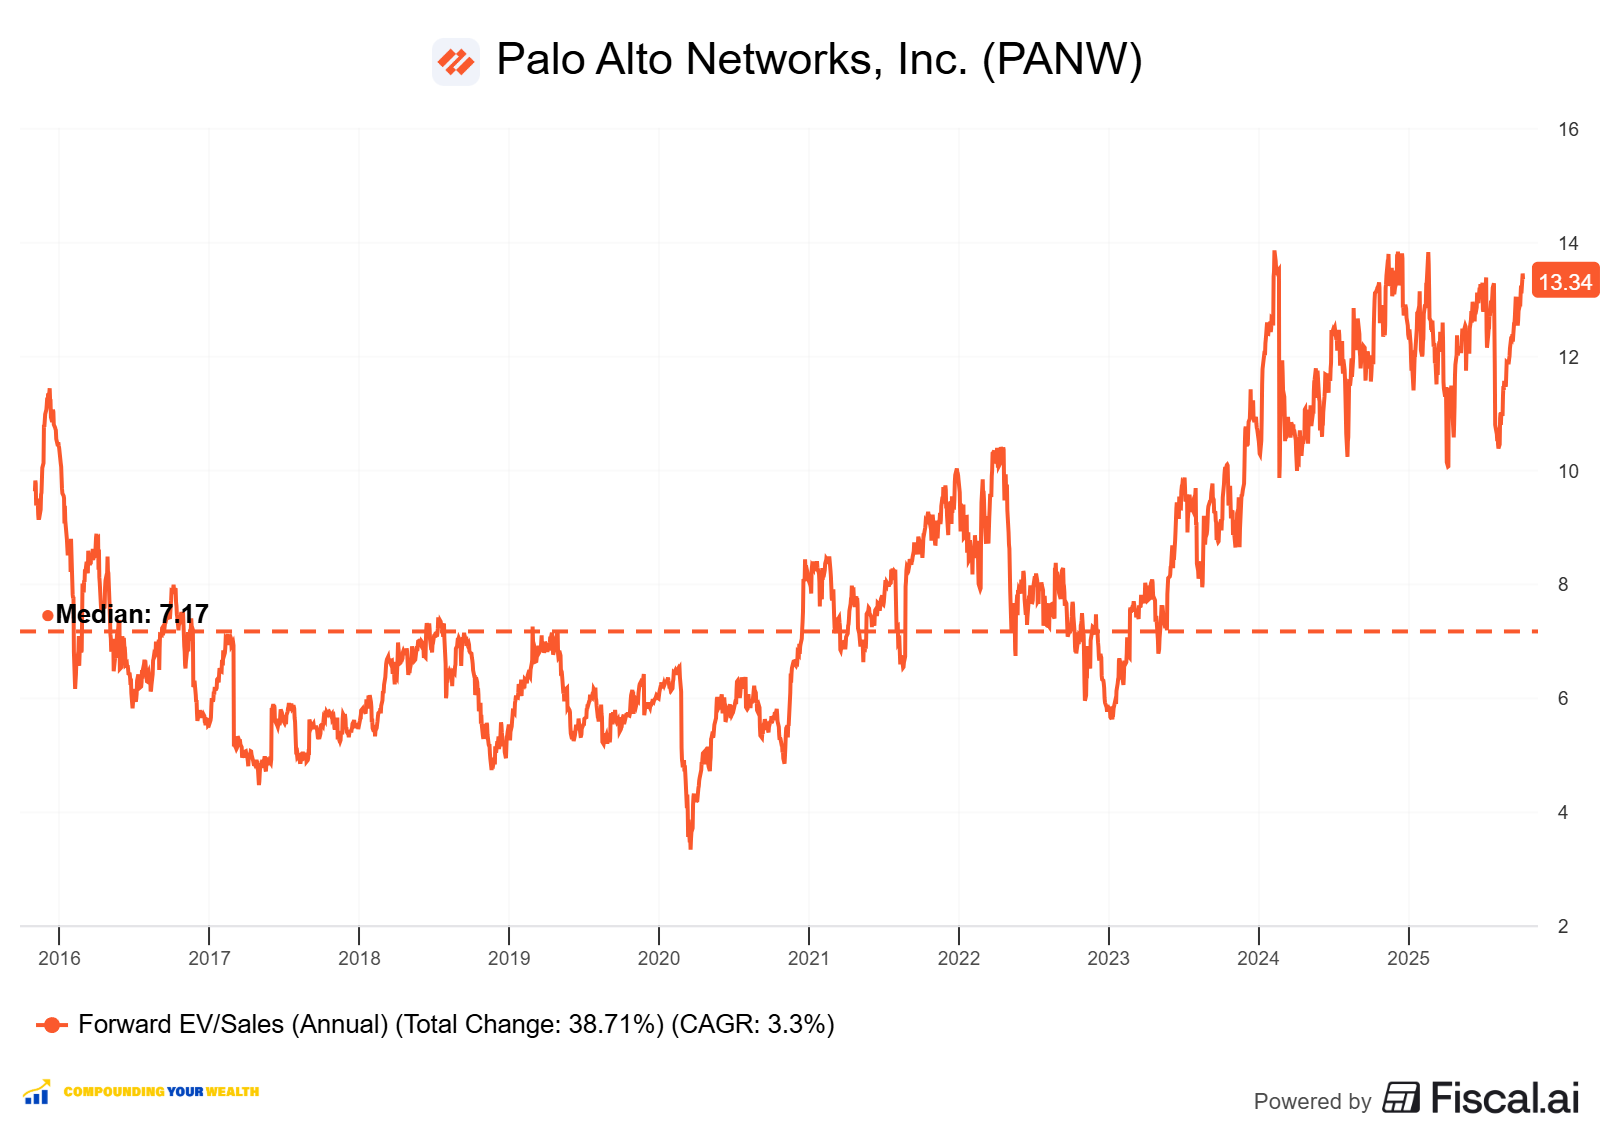
Powered by Fiscal.ai — get 15% off with affiliate link for Compounding Your Wealth readers.
$PANW Palo Alto trades at a Forward P/E of 54.6, with a revenue growth of 15.8% YoY in the last quarter. This forward P/E ratio is 3.4 times the anticipated revenue growth rate.
The EPS growth forecast for 2026 is 12.9% and P/E of 53.4, with a 2026 PEG ratio of 4.1.
According to PEG ratio valuation is high.
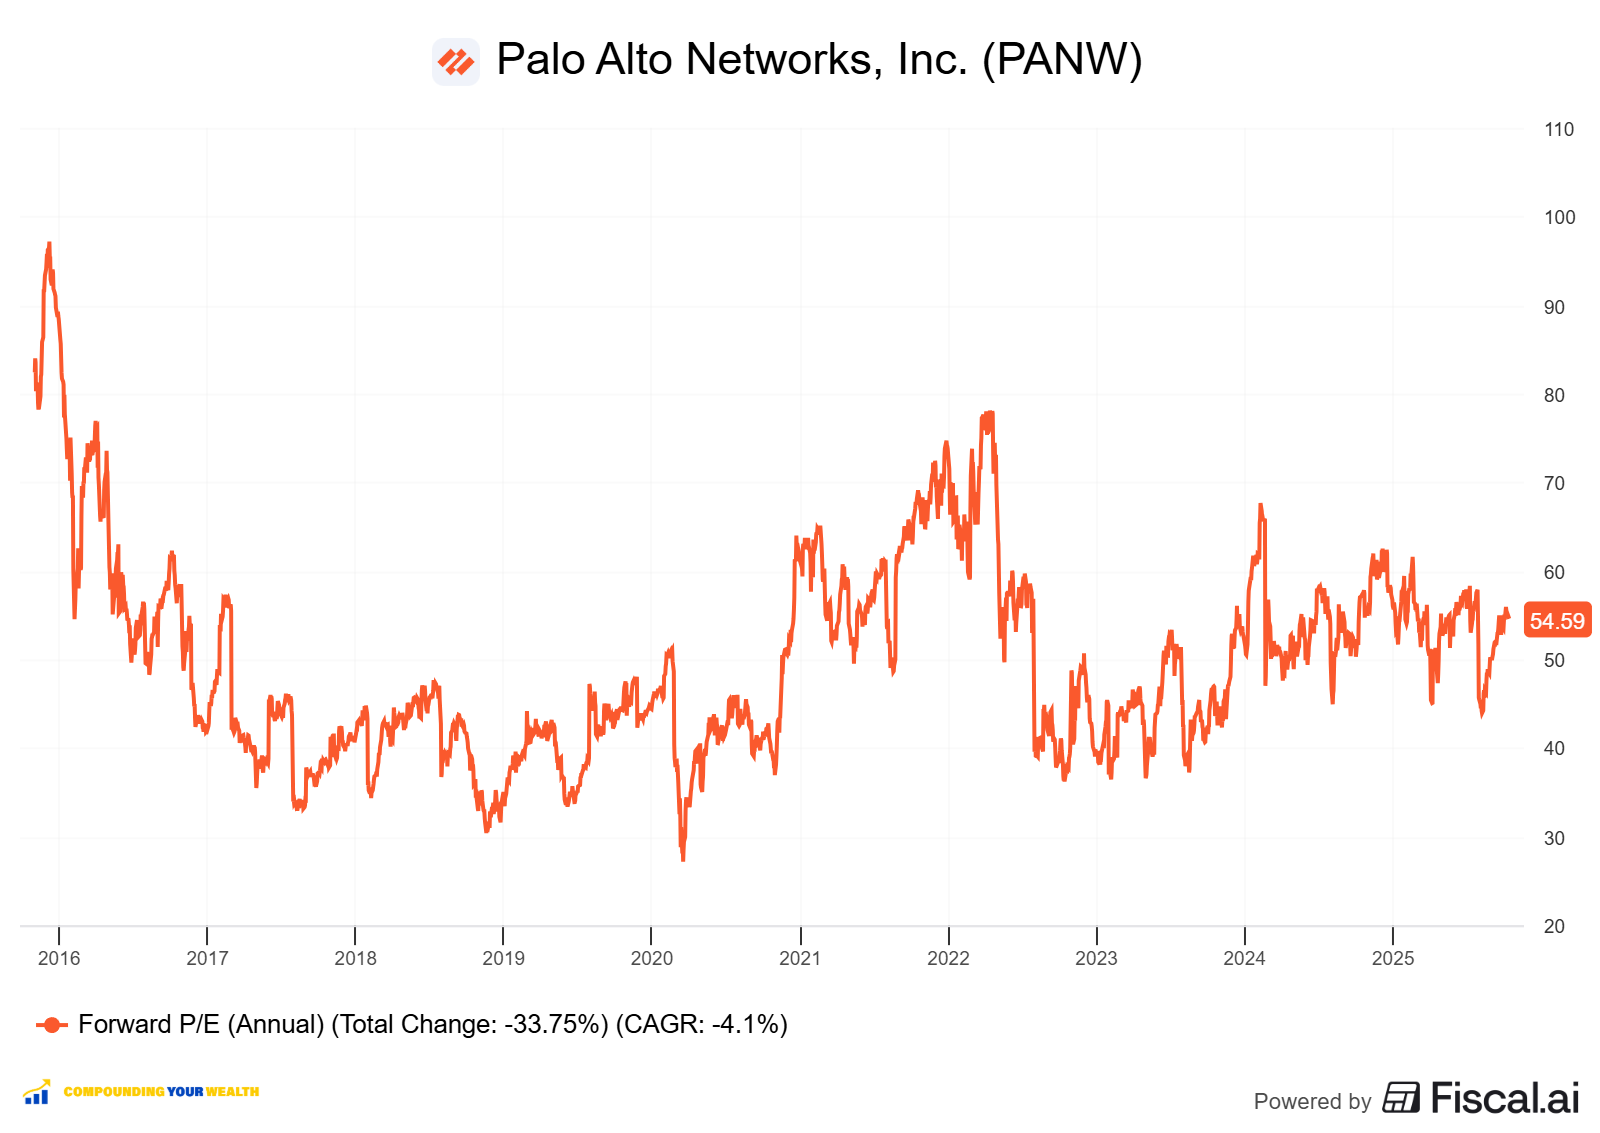
Powered by Fiscal.ai — get 15% off with affiliate link for Compounding Your Wealth readers.
The PEG (Price/Earnings to Growth) ratio is a key tool for evaluating growth stocks, introduced by Peter Lynch.
PEG < 1: Undervalued – A ratio below 1 suggests the stock is undervalued. For example, if the P/E is 15 and earnings are expected to grow by 20%, the PEG would be 0.75, indicating a good buying opportunity.
PEG = 1: Fair Value – A PEG of 1 means the stock price matches its growth expectations, representing fair value.
PEG > 1: Overvalued – A PEG above 1 indicates the stock may be overvalued, as its price is higher than its projected growth rate, making it riskier.
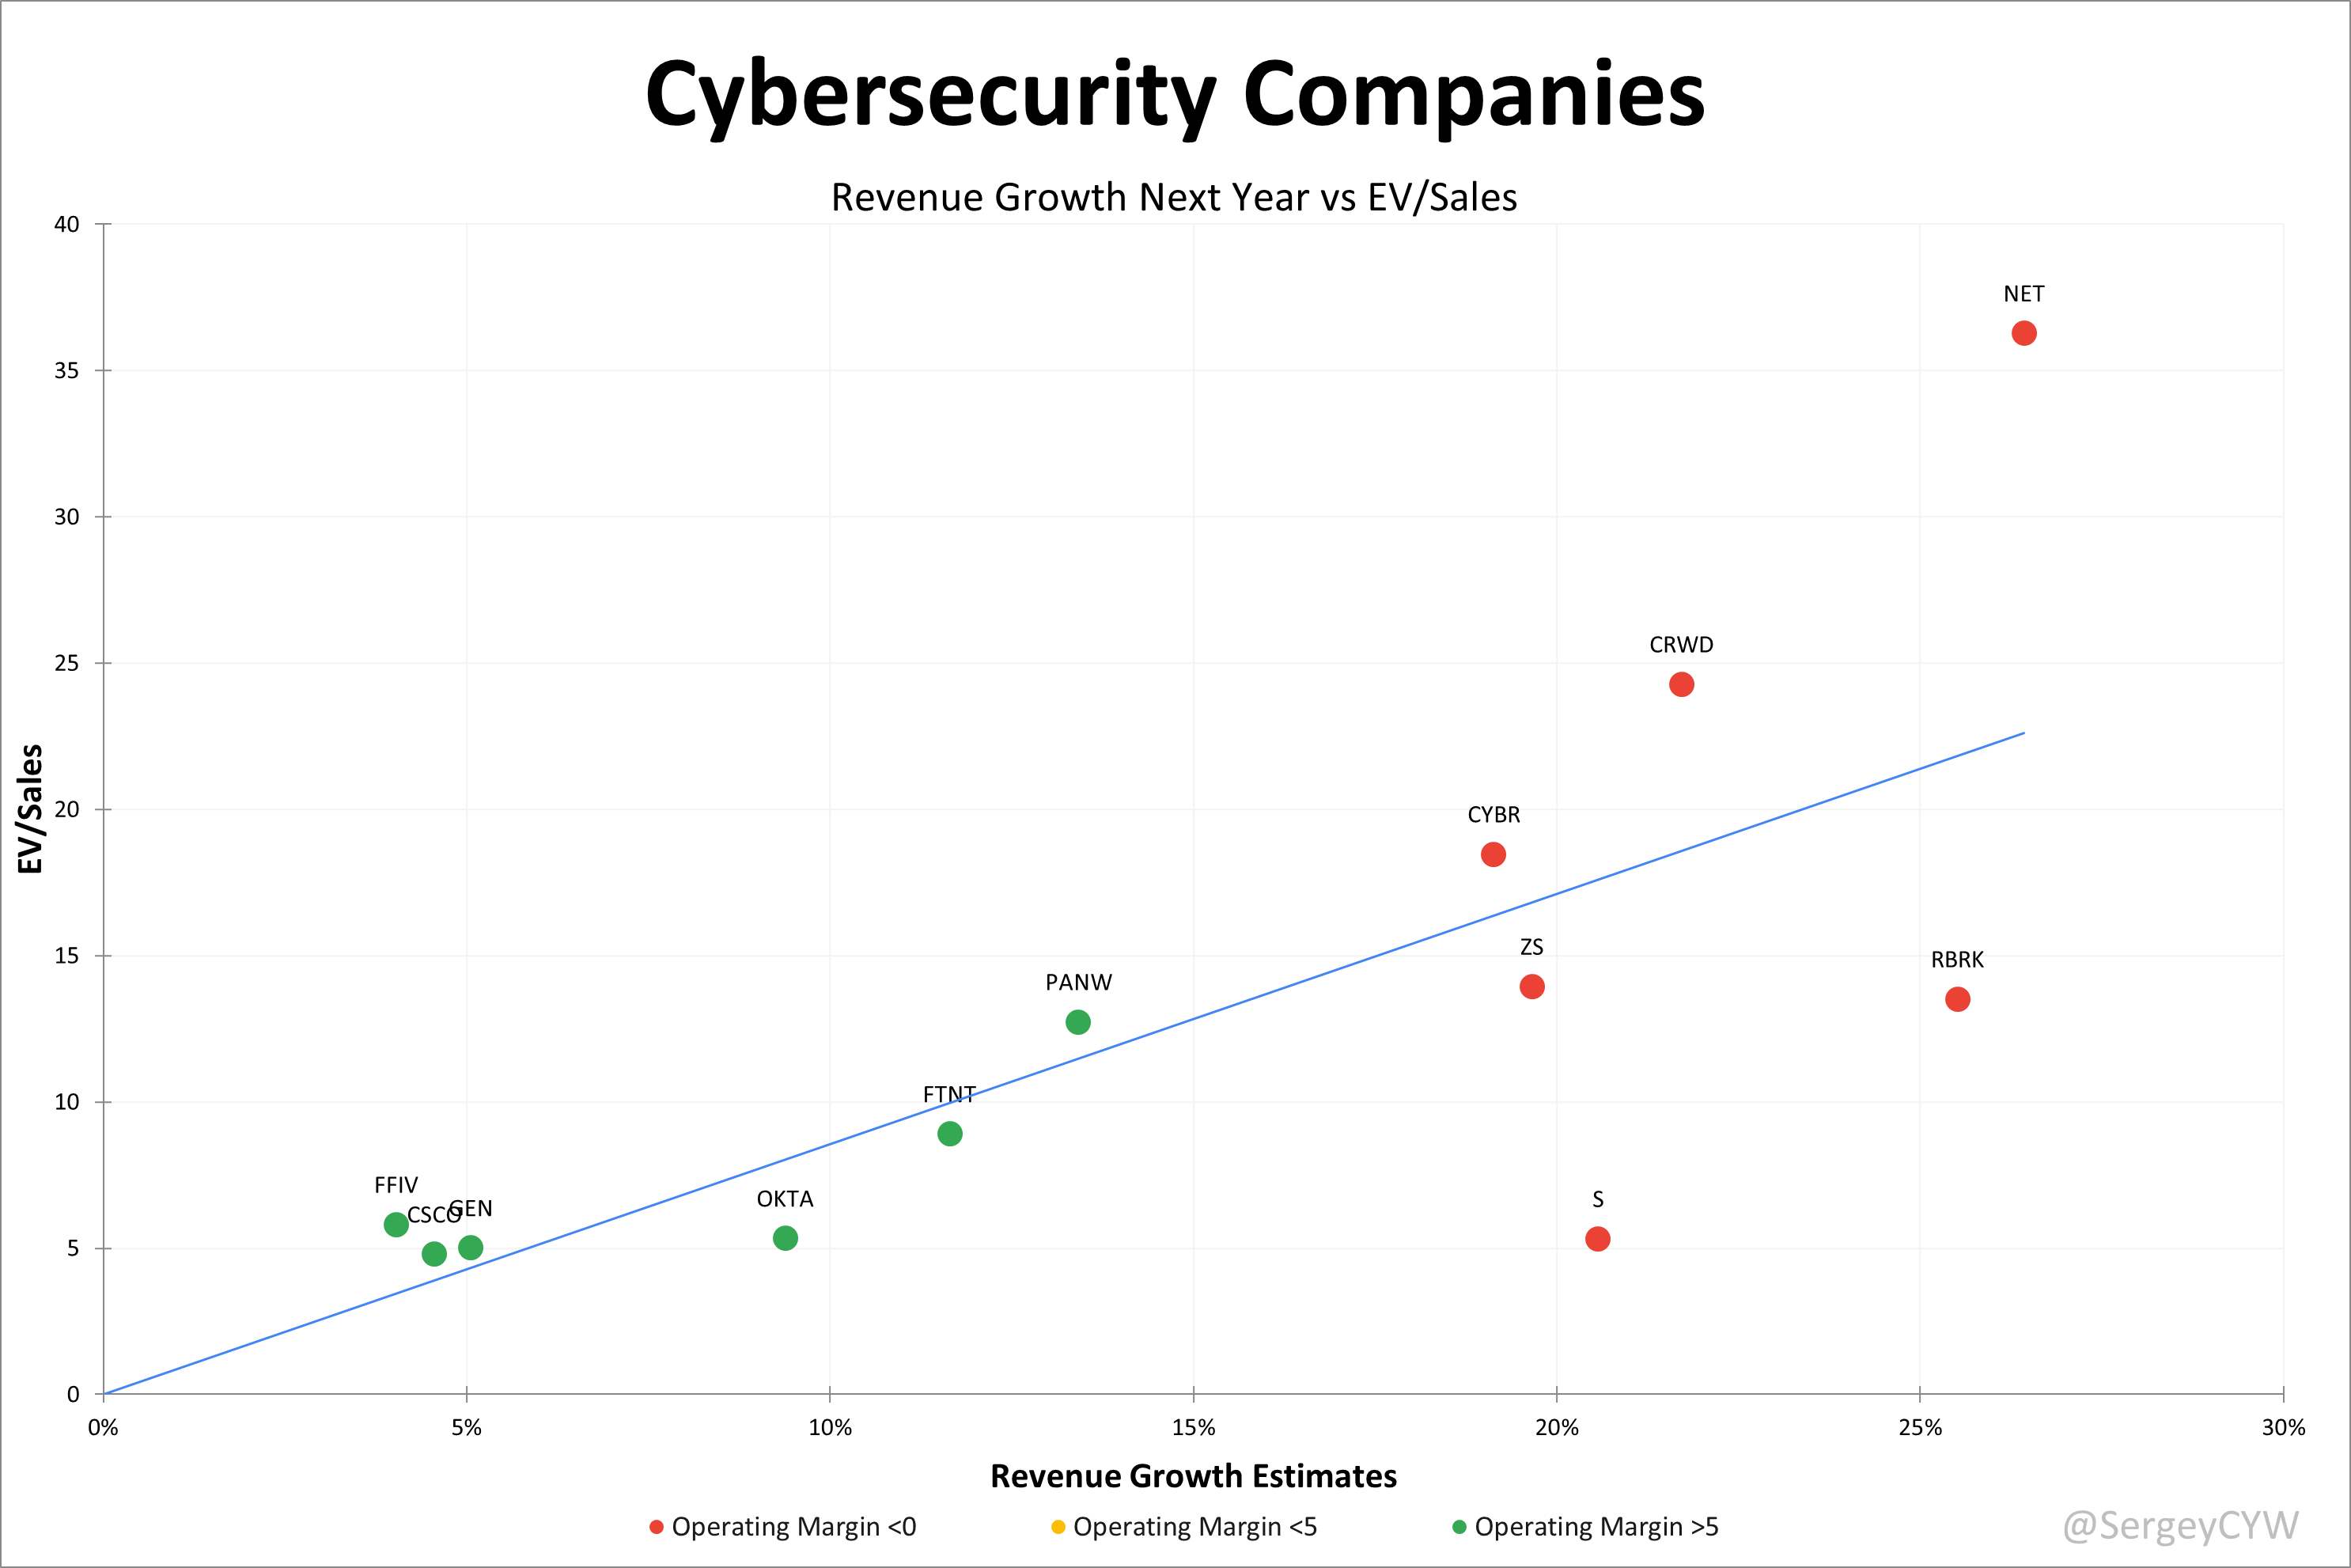
Valuation comparison
Analysts’ revenue growth forecast for $PANW in 2025 is +16.3%, and +13.4% for 2026. Considering this forecast, the valuation based on the EV/Sales multiple appears fair when compared to other companies in the cybersecurity sector.
Analysts expect solid revenue growth, so let’s examine the key metrics to determine whether these expectations are justified.
We’ll evaluate the company’s economic moat, which supports long-term revenue growth, analyze revenue trends and the forecast for next quarter, and identify key factors that could help the company exceed expectations and sustain future growth.
We’ll assess the performance of key segments, the launch of new products and updates, customer acquisition growth, key financial metrics, financial stability, and margin trends.
Additionally, we’ll review the SBC/Revenue ratio, shareholder dilution, and finally, draw conclusions on the company’s outlook.
3. Economic Moat
Economic Moats enable companies to remain stable during crises and support long-term revenue growth.
Economies of Scale
Palo Alto Networks exhibits powerful economies of scale that have strengthened with growth. The company maintains a non-GAAP gross margin above 75% in Q2, showcasing operational efficiency across an expanding revenue base. With over 85,000 organizations in 150+ countries using its platform, Palo Alto Networks benefits from cost advantages in R&D, manufacturing, and operations. Scale enables heavy investment in innovation—around 15% of revenue—while sustaining profitability. Holding a 22.9% market share in network security deepens supplier relationships and procurement leverage, reinforcing a durable scale moat.
Network Effect
The company’s network effect in threat detection is significant. Its AI systems process 1.5 trillion network events daily with 99.7% detection accuracy. Each additional customer strengthens the system’s intelligence, improving protection speed and precision. With insights from 85,000 global clients, Palo Alto Networks identifies and stops threats up to 180x faster than competitors. Its XSIAM platform ingests 12 petabytes of data per day, enabling real-time analytics and rapid incident response. As adoption grows, the network becomes smarter and increasingly difficult to replicate.
Brand Strength
Palo Alto Networks commands one of the most trusted brands in cybersecurity. Recognized as a Leader in Gartner’s Magic Quadrant for Network Firewalls, the company serves 85 of the Fortune 100 and over 50% of U.S. federal agencies. Operating in 150+ countries, it now leads in 13 analyst-recognized categories, up from 9 in 2020. With a Net Promoter Score of 67 and 98% “Willingness to Recommend” on Gartner Peer Insights (based on 198 reviews, January 2025), the brand drives shorter sales cycles and higher conversion rates—creating a reputation moat few can match.
Intellectual Property
Palo Alto Networks holds over 1,200 active patents and files roughly 300 new applications annually. As of April 2025, it manages 2,013 active patents and applications, reflecting consistent innovation across network, cloud, and AI-driven security. While the company faced a $151.5 million settlement with Centripetal Networks, its expanding IP base forms a strong defensive barrier. Sustained patent growth supports leadership in proprietary cybersecurity technologies and AI systems.
Switching Costs
Leaving Palo Alto Networks carries high operational risk. Average downtime costs $5,600 per minute, deterring platform transitions. Its integrated architecture—spanning network, cloud, and security operations—makes replacement expensive and complex. According to Forrester, customers report a 50% reduction in security management effort using the unified platform. The company amplifies lock-in through deep integration between SIEM and endpoint solutions, such as XSIAM’s required Cortex agent usage. By offering free products for the duration of competitors’ contracts, Palo Alto accelerates platform adoption, knowing high switching costs ensure enduring customer loyalty.
Palo Alto Networks’ wide economic moat is built on multiple reinforcing competitive advantages, with switching costs and network effects providing the strongest protection. The combination of these moats creates a formidable defensive position that should enable sustained profitability and market leadership in the growing cybersecurity market.
4. Revenue growth
$PANW — revenue growth in Q2 accelerated to +15.8% YoY, continuing the recovery from Q2 2024, when growth had slowed to +12.1% YoY.
If the company beats next quarter’s guidance by ~1.0%, as it did in Q2, Q3 growth could reach +16.7%, signaling continued revenue acceleration.
RPO growth in Q2 accelerated to +24.2% YoY, well ahead of revenue, indicating strong forward demand.
On the flip side, billings grew +6.5% YoY, which is slower than both last quarter and overall revenue growth.

5. Segments and Main Products.
Palo Alto Networks operates across three core segments—Network Security, Cloud Security, and Security Operations—offering integrated solutions for modern enterprise environments.
Network Security provides next-generation firewall solutions, including hardware, virtual, and cloud firewalls, delivering deep traffic visibility and threat prevention.
Cloud Security is delivered through Prisma Cloud, covering posture management, workload protection, network security, and entitlements.
Security Operations leverages Cortex XDR and Cortex XSOAR. XDR offers AI-powered detection across endpoints and cloud. XSOAR automates incident response and SOC workflows.
Prisma SASE combines secure access and networking in one platform—integrating SWG, CASB, ZTNA, and FWaaS. Pricing ranges from $1,000 to $10,000+ per year, based on user count and feature set.
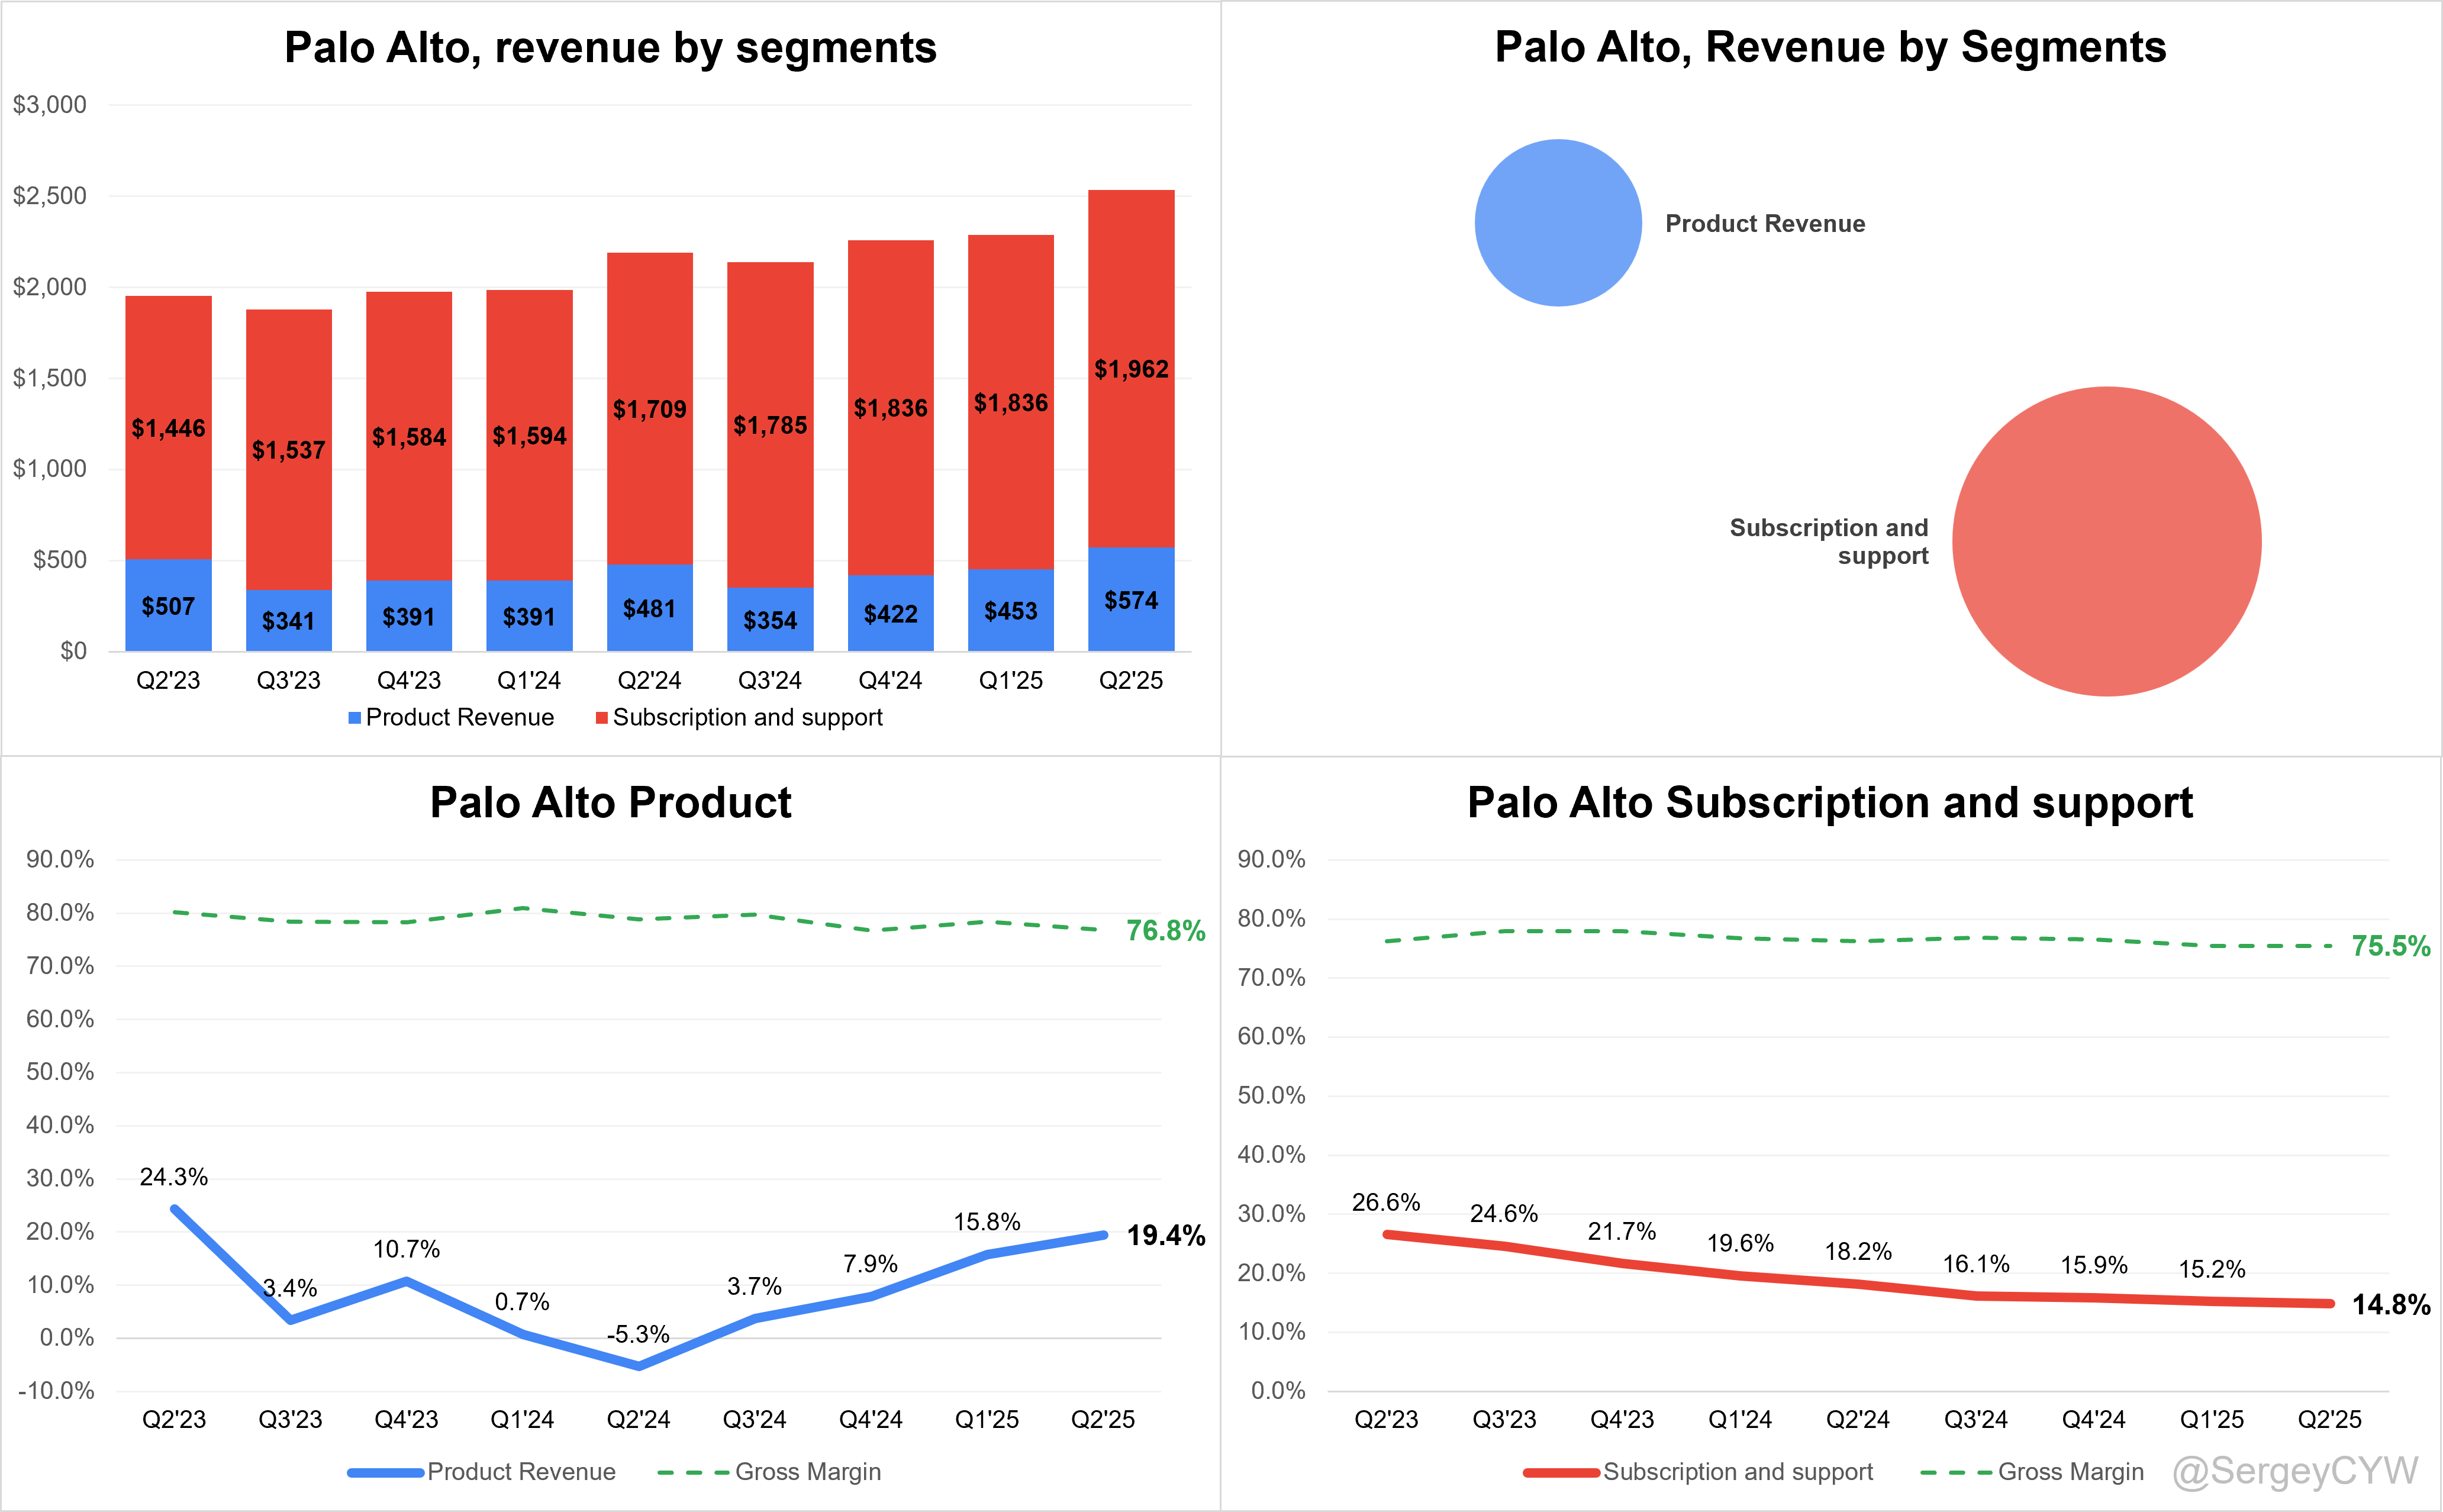
$PANW Revenue by Segment: 77,4% of the company’s revenue comes from Subscription and Support, while 22,6% is from Product Revenue.
Subscription and Support revenue growth continues to slow, reaching +14.8% YoY in Q2, with a gross margin of 75.5%.
Product Revenue growth showed a recovery at +19.4% YoY after a decline in Q2 2024, though the gross margin slightly decreased to 76.8%.
Network Security
Momentum accelerated as mix shifts to software; 56% of Q4 product revenue from software; TTM software mix >40%. Software firewalls grew ARR ~20% and nearly 2x TCV; market share ~50% and native across all major clouds. Next-gen network security ARR hit $3.9B (+~35%). Hardware demand improved modestly; outlook mid-single-digit growth FY26. Largest SASE win ever: $60M, ~200k seats. Competitive displacements in 70+ SASE accounts (>$200M TCV). Customer base broadening: 6,300+ SASE customers, covering ~1/3 of the Fortune 500. Challenge: ongoing hardware maturation; execution hinges on platform consolidation and cloud depth.
Cortex
Cortex + Cloud combined ARR ~+25% YoY. XDR million-dollar deals +30%. FedRAMP High for Cortex Cloud expands public-sector reach. Strategy is convergence: CNAPP + AI-SOC + runtime protection to stop attacks in real time. Pipeline “hundreds” of customers for runtime/cloud SOC. Success led by faster MTTR and integrated data plane. Watchpoint: migration to Cortex Cloud is an execution task at scale.
Prisma Cloud & XSIAM Performance
XSIAM is the growth engine. ~400 customers; avg ARR >$1M; >60% of deployed customers report MTTR <10 minutes. ~25% of XSIAM customers are Global 2000. Prisma Cloud thesis strengthened post-launch of Cortex Cloud: shift-left (secure development) plus shield-right (runtime protection). Early customer validation and pipeline momentum strong. Competitive backdrop tightening, but integration across posture, runtime, and SOC is differentiator.
Strata Platform
Strata (network security platform) keeps compounding via software and integrated subscriptions. Strong attach on CASB and DLP; unified management via Strata Cloud Manager contributed ~$17.5M to NGS ARR in Q4 (immaterial overall but rising). Goal is a single policy plane across appliances, SASE, and virtual firewalls to drive higher retention and upsell. Net retention among platform customers ~120% with near-zero churn.
AI-Powered SOC
AI is now the operating system of the SOC. XSIAM automates detection-to-response, collapsing weeks to minutes. Data network spans network, cloud, and endpoint to feed proprietary models; same data spine now spawning “peacetime” modules (exposure management, email security) with ~$18B FY26+ TAM. AI ARR ~ $545M, ~2.5x YoY, signaling rapid monetization of AI features.
Innovations & Product Updates
PAN-OS 12.1 “Orion.” Quantum-readiness path, multi-cloud security fabric, cloud networking to power cloud-native and AI firewalls.
Prisma AIRS. End-to-end AI runtime security for apps, agents, models, and datasets; landed an 8-figure Q4 deal; positioned as 5-year growth vector.
AI Access Security. Controls use of third-party GenAI in the enterprise with integrated DLP.
Prisma Access Browser. Browser becomes enterprise OS for AI apps. >3M licenses sold in Q4; cumulative seats >6M; notable win 80k seats at a US pharma.
Application Security Posture Management (ASPM). Natively in Cortex Cloud to unify dev-to-prod risk.
Acquisition
The planned acquisition of CyberArk extends Palo Alto into identity security, adding reach to 8M privileged users and presence in over 50% of the Fortune 500. Management expects the combined businesses to double value in five years, leveraging a 10x larger salesforce and 75,000 customers. Post-integration, free cash flow margin is targeted at 40%+ by FY28.
ProtectAI Acquisition Closed. Augments AI security stack across platform.
Leadership
Founder Nir Zuk announced retirement after more than two decades, having pioneered the next-generation firewall. Lee Klarich was appointed Chief Product & Technology Officer and added to the board to ensure continuity of product strategy.
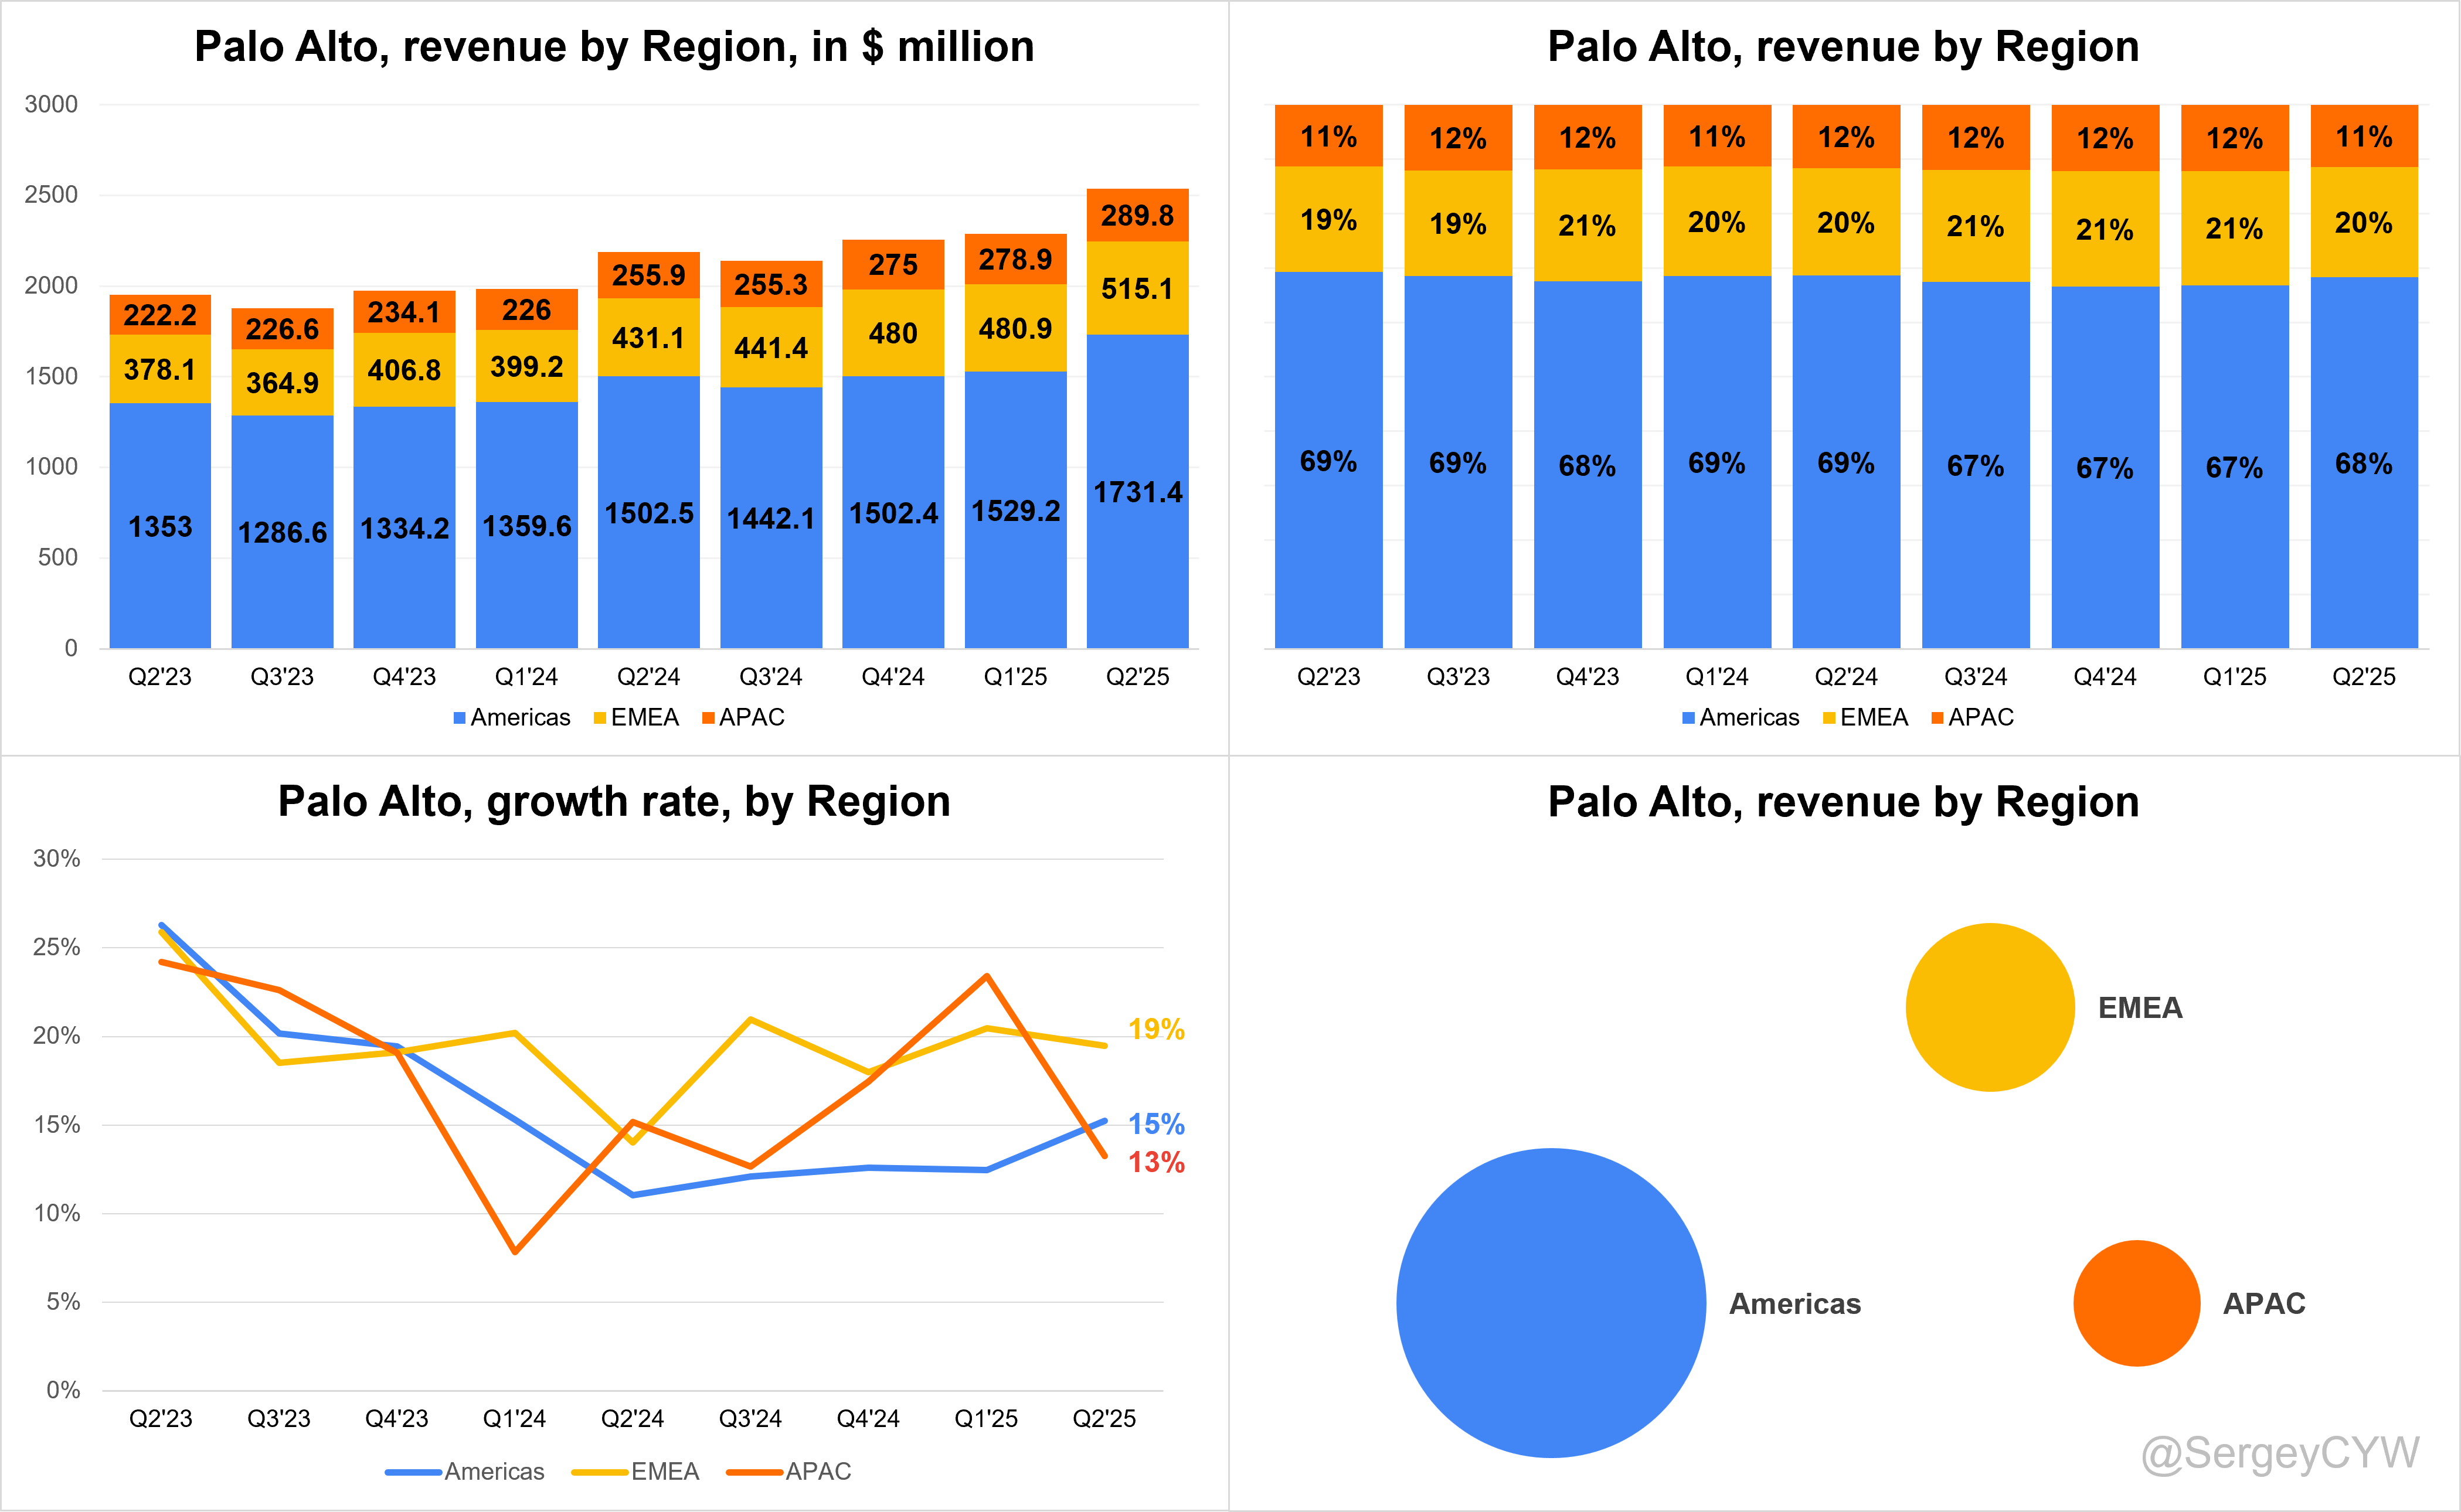
Revenue by Region
The Americas region accounts for 68% of total revenue, making it $PANW Palo Alto’s largest market, with revenue growth accelerated to +15% YoY in Q2.
The EMEA region contributes 20% of total revenue, with growth stabilizing at +19% YoY.
The APAC region remains the smallest by revenue, and its growth decelerated to +13% YoY, from +23% in Q1.
Both EMEA and APAC are growing faster than the company’s overall revenue growth rate — a sign of expanding international momentum.
6. Market Leadership
Palo Alto Networks maintains dominant market leadership across cybersecurity categories through consistent recognition from premier industry analysts. The company’s comprehensive platform approach delivers sustained competitive advantages validated by multiple rating agencies.
Palo Alto Networks is the only vendor recognized as a Leader for the third consecutive year in the 2025 Gartner Magic Quadrant for SASE Platforms. Industry trends show 30% of large organizations will consolidate to a single SASE platform by 2028.
Prisma SASE delivers a fully integrated, cloud-native platform with advanced SSE and SD-WAN features, providing secure, efficient access to applications and data for users everywhere.

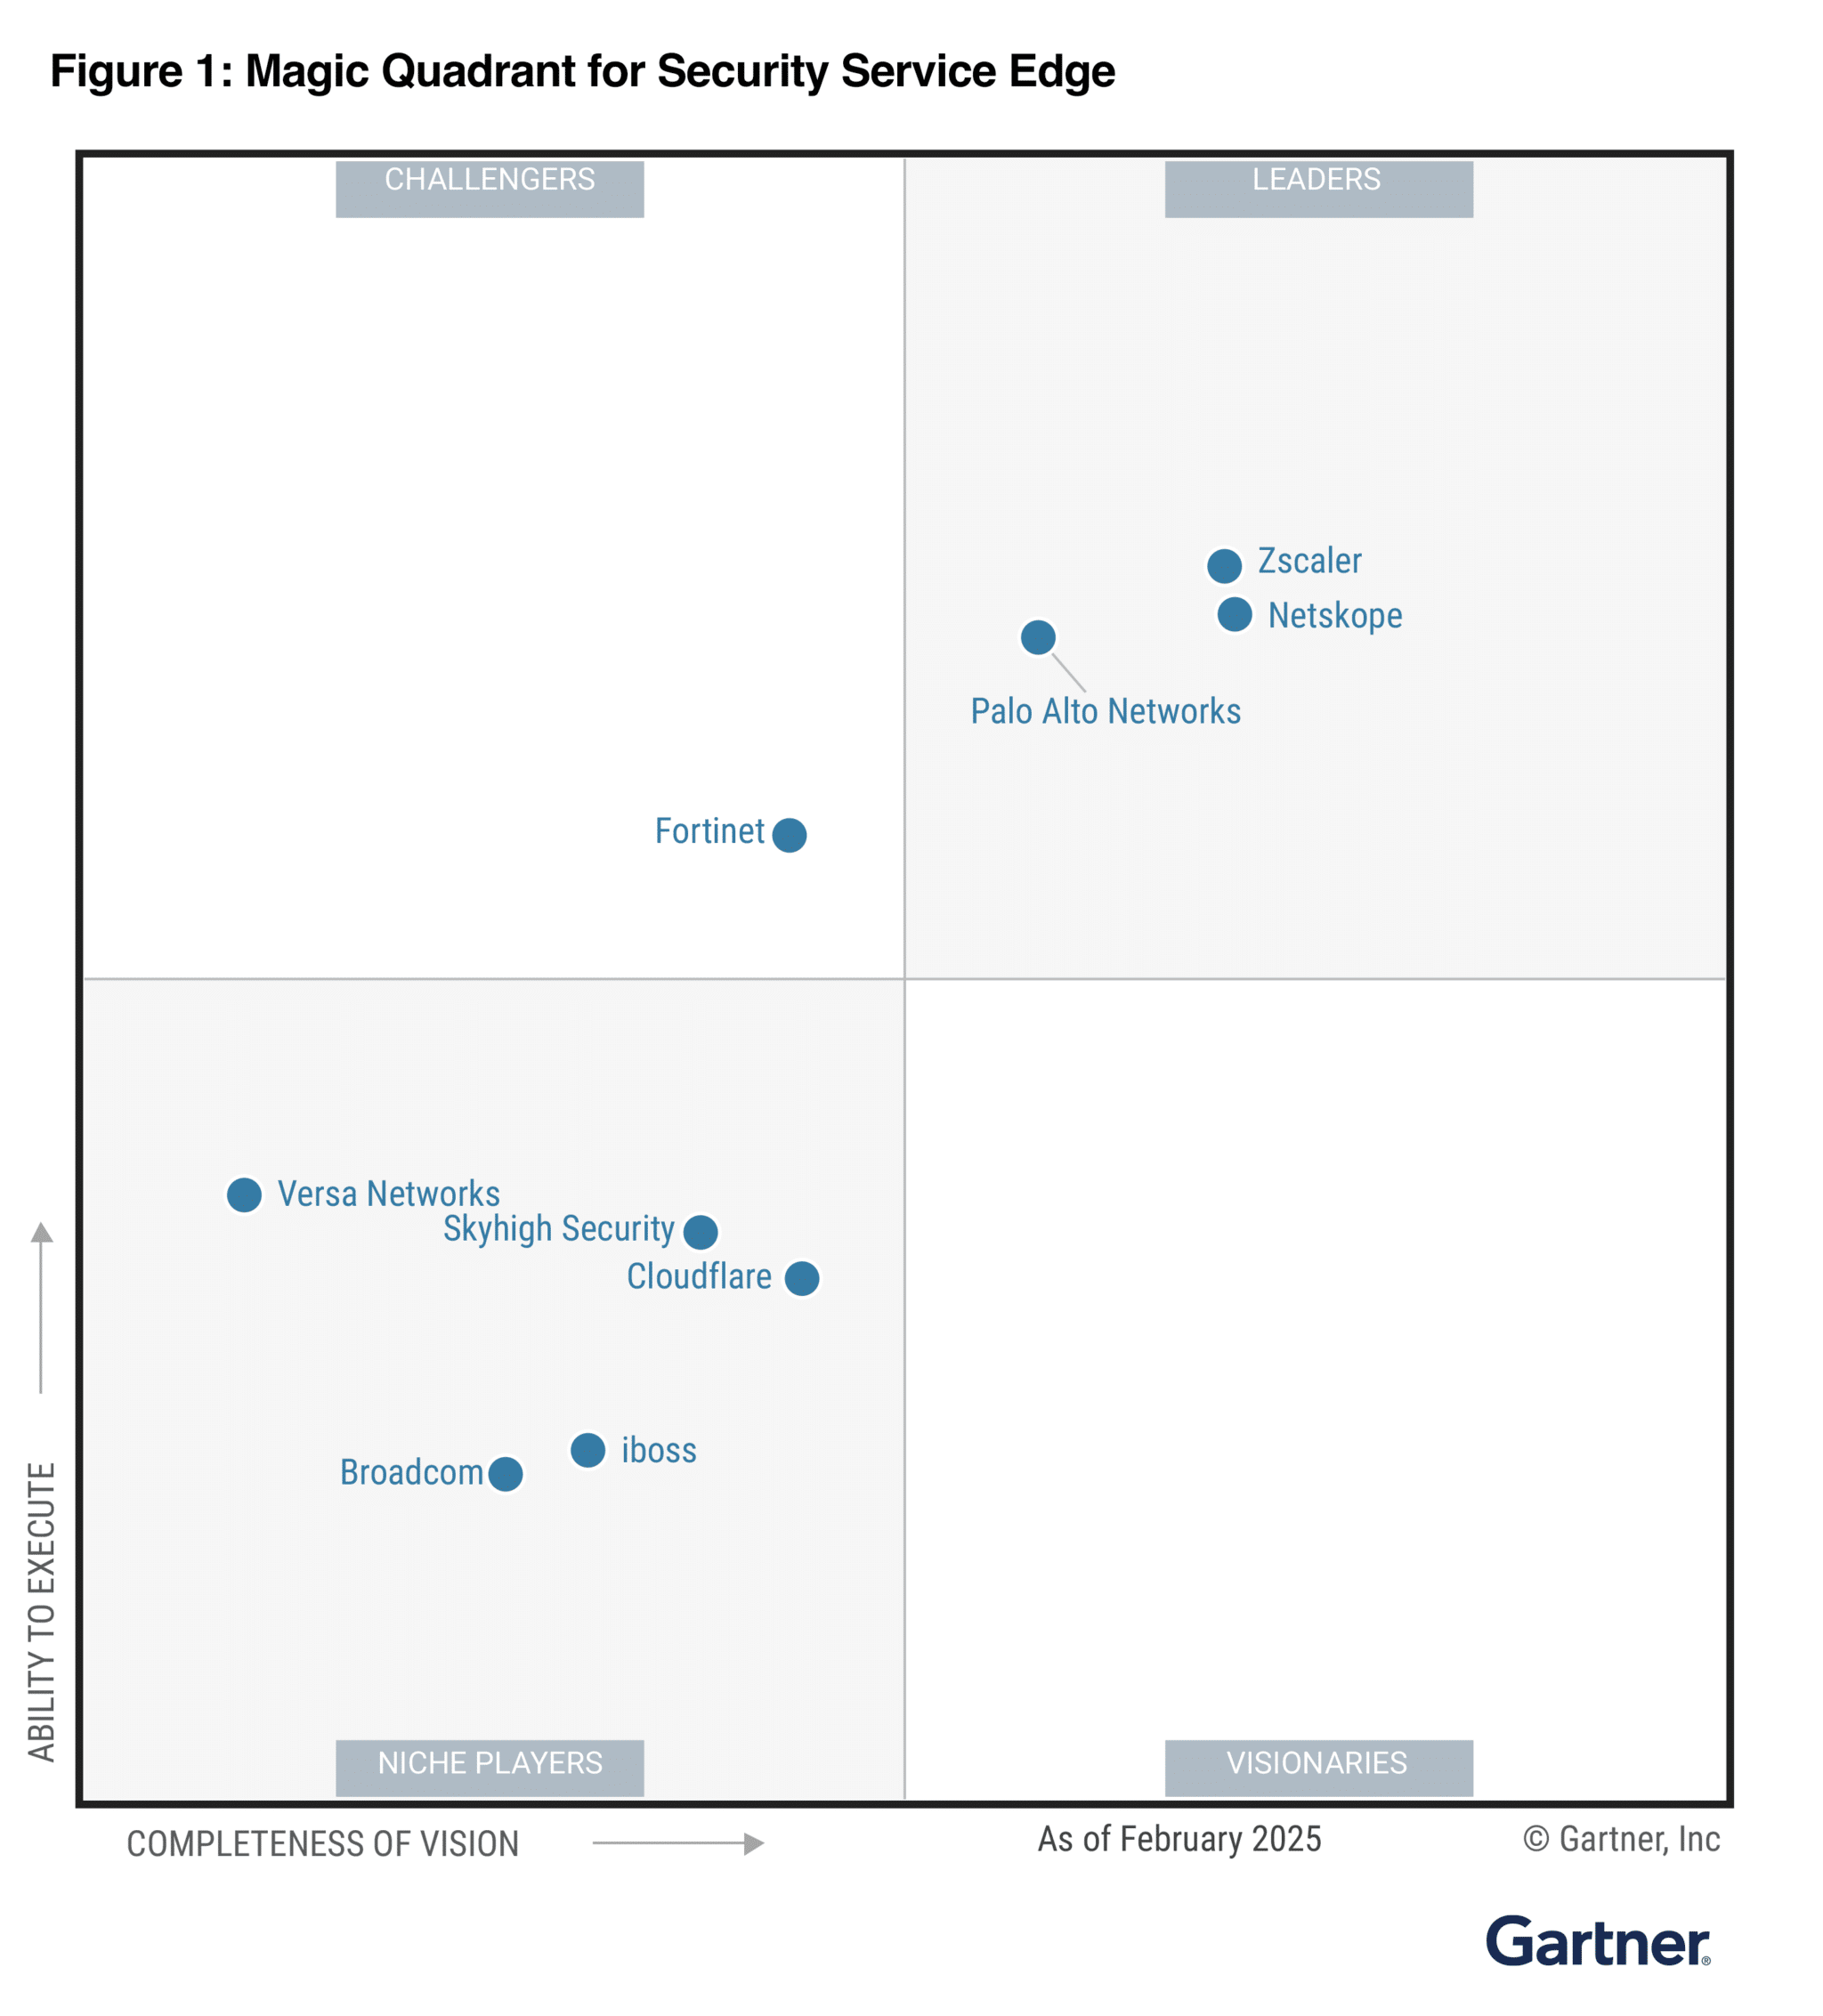
Palo Alto Networks received the highest overall score for Prisma Access in the Advanced SSE use case. Also named a Leader in the 2025 Gartner Magic Quadrant for Security Service Edge for the third year in a row.
Recognized as a Leader in all three major Gartner Magic Quadrant reports—SSE (2025), Single-Vendor SASE (2024), and SD-WAN (2024)—Palo Alto Networks demonstrates sustained innovation in unified cloud security, precision AI, and threat intelligence.
Palo Alto Networks is named a Leader in the 2025 Gartner Magic Quadrant for Endpoint Protection Platforms for the third consecutive year, driven by its AI-powered Cortex XDR solution. Cortex XDR achieved 100% detection with technique-level detail in the latest MITRE ATT&CK evaluation — completed in real time with zero configuration changes. Customers rated Palo Alto Networks 98% “Willingness to Recommend” on Gartner Peer Insights, based on 198 reviews as of January 2025.

Palo Alto Networks is recognized as a Leader in The Forrester Wave: Zero Trust Platforms, Q3 2025, earning the highest score in the Current Offering category.
The platform received a score of 5—the highest possible—in 11 criteria, including innovation, workforce security, identity, and analytics.
With a unified approach to zero trust, SASE, and network security, Palo Alto Networks continues to set benchmarks for proactive cyber defense and operational resilience.

Palo Alto Networks is named a Leader in The Forrester Wave: Enterprise Firewall Solutions, Q4 2024, with top scores in Current Offering, Vision, Innovation, and Roadmap.
Pioneered next-generation firewall (NGFW); continuously adapts to evolving network security.
Strata Network Security Platform delivers centralized management for both hardware and software firewalls, supporting hybrid enterprise environments.
Precision AI system automates security tasks with advanced machine learning, deep learning, and AI—driving a roadmap aligned with secure, future-ready enterprise needs.

7. Customers
Customer Success Stories
Global consulting firm consolidated on the platform with an over $100M Q4 purchase spanning cloud security and SASE, including AI Access Security. Problem statements were identity entitlement gaps in AI/cloud and a need for globally scalable secure access. Deep C-suite sponsorship enabled rapid execution. Status now is fully platformized with ~$50M ARR to Palo Alto Networks and a multiyear expansion path.
European bank executed a $60M+ transformation anchored on XSIAM to tame an expanding attack surface while simplifying the stack and controlling cost. Platformization was the competitive wedge. Outcome is adoption of three platforms with unified policy and higher operational leverage.
US insurance leader invested $33M across Network Security, SASE, SecOps, and Cloud. Target metric was 15-minute mean time to contain. Deployment emphasizes AI/ML-assisted analysts and false-positive reduction. Result is platformization across network, cloud, and security operations with accelerated incident response.
Public sector momentum advanced with FedRAMP High on Cortex Cloud, opening regulated workloads to the runtime-plus-SOC architecture. Customer feedback centered on real-time cloud attack stoppage rather than posture reporting, reinforcing the convergence thesis.
Enterprise browser adoption inflected as AI agents move into the workflow. A leading US pharmaceutical company purchased Prisma Access Browser for 80k seats in a >$3M transaction, driving cumulative browser seats to >6M and positioning the browser as a controllable OS-layer for AI apps.
Large Customer Wins
Largest SASE award to date closed at $60M with a global professional services firm covering ~200,000 seats. Seat scale and WAN modernization favored a single policy plane and full-stack controls. Pipeline quality improved with a record count of 8-figure SASE deals.
Software firewall scale-up included a $60M agreement that materially expanded partnership with a leading US-based cloud provider. Aggregate activity across hyperscalers reached 9-figure TCV in Q4 as customers standardized on cloud-native NGFWs with one pane of glass across multi-cloud.
AI runtime security advanced with an 8-figure Prisma AIRS deal at a global professional services company, validating end-to-end security for apps, agents, models, and datasets as AI adoption surges.
Competitive takeaways in SASE surpassed 70 accounts with >$200M TCV displaced over the past year, underscoring share gains at scale.
Large-customer mix improved sharply. Customers at $5M and $10M ARR grew ~50% YoY; $20M+ ARR customers grew ~80% YoY. Platform customer net retention ran ~120% with near-zero churn, supporting durable multi-product commitments.
8. KPI
ARR Growth
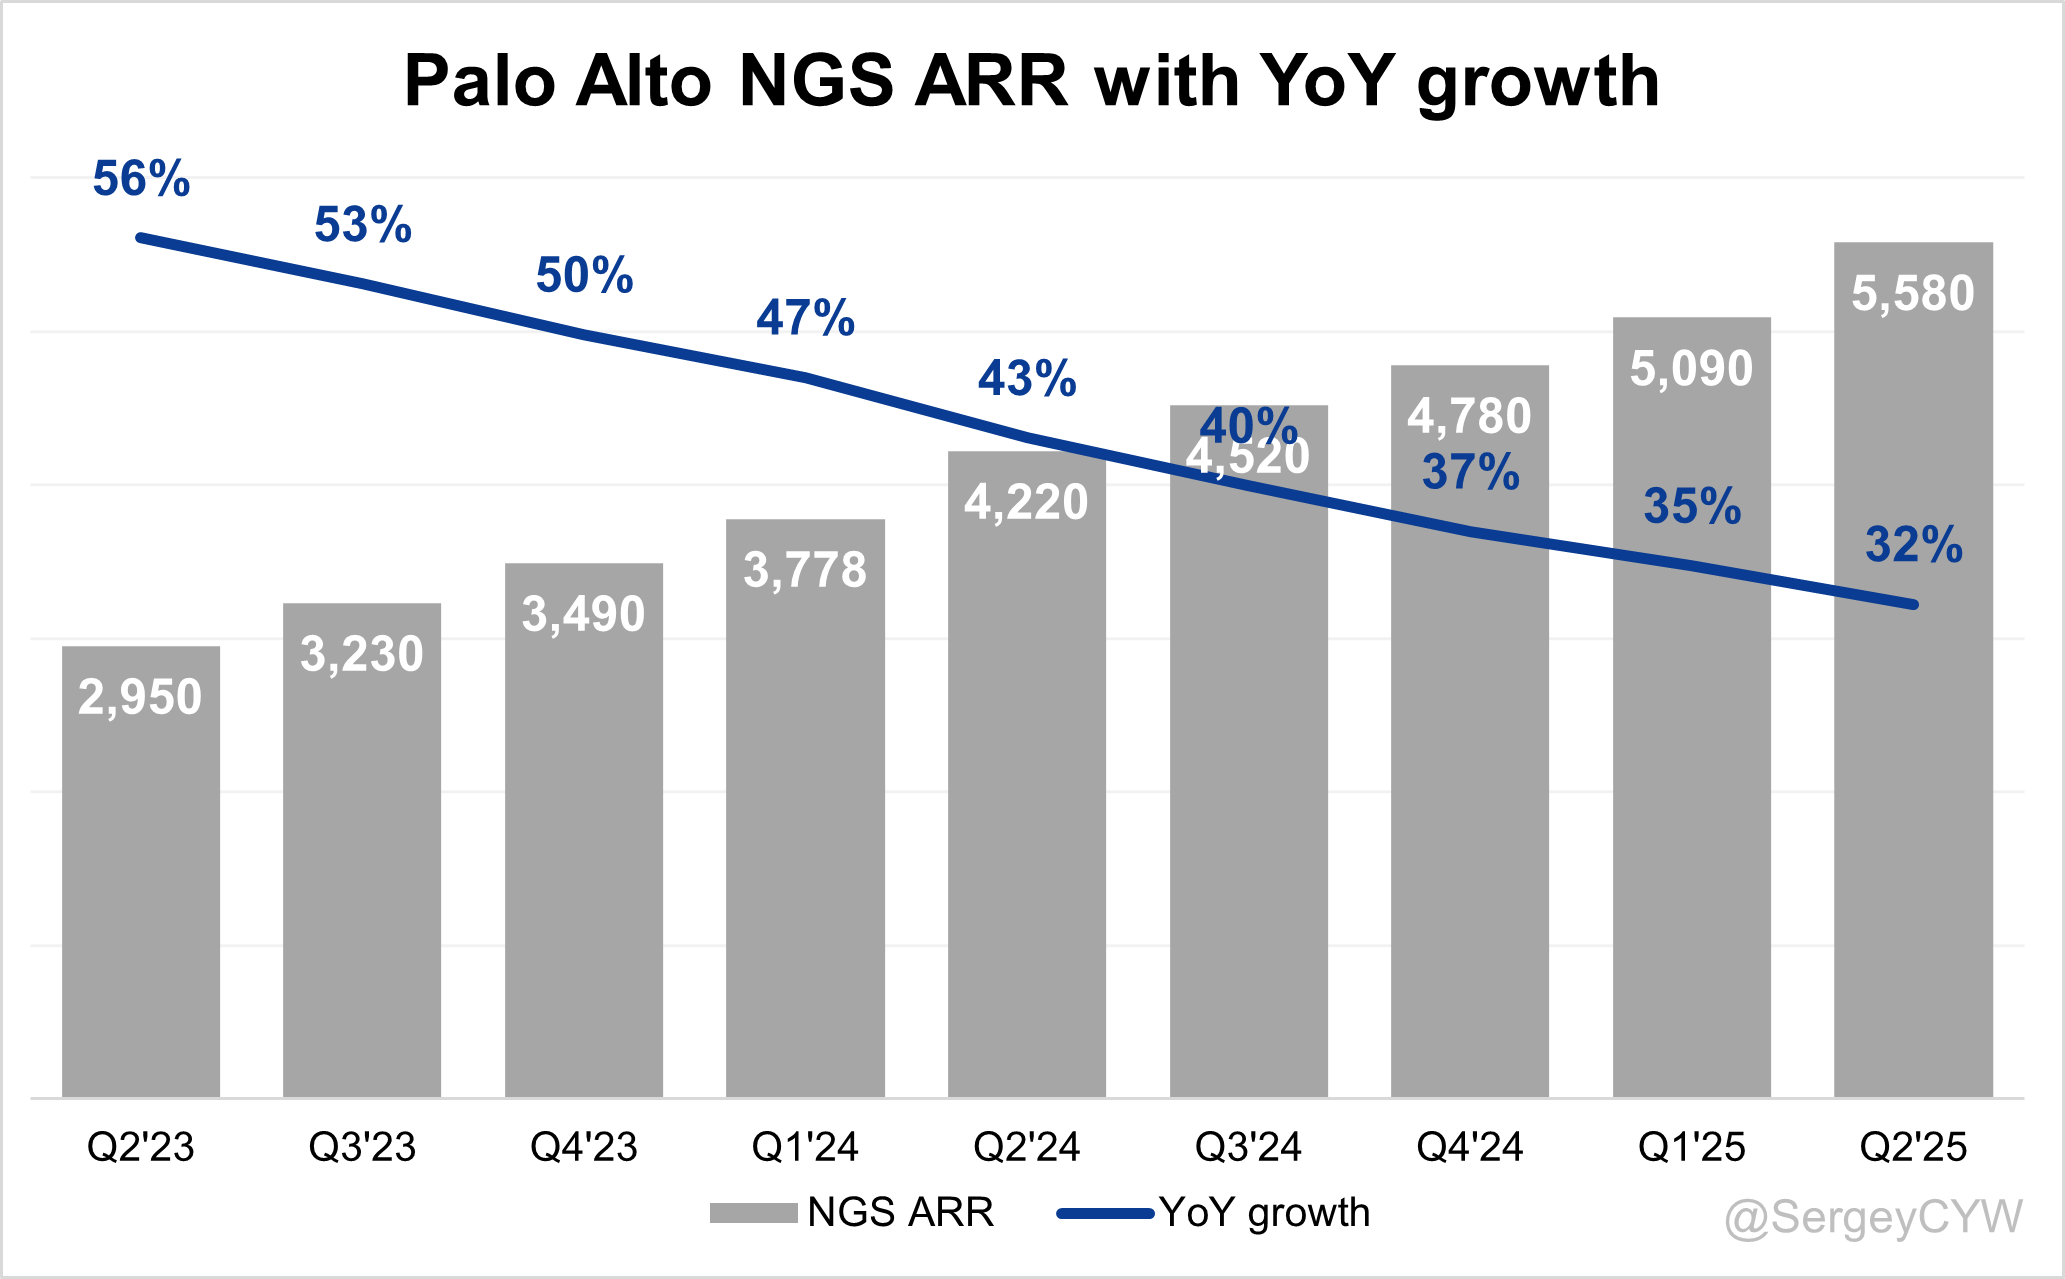
Palo Alto $PANW NGS ARR growth is slowing, reaching +32% YoY in Q2, which is above the company’s revenue growth.
Net new ARR
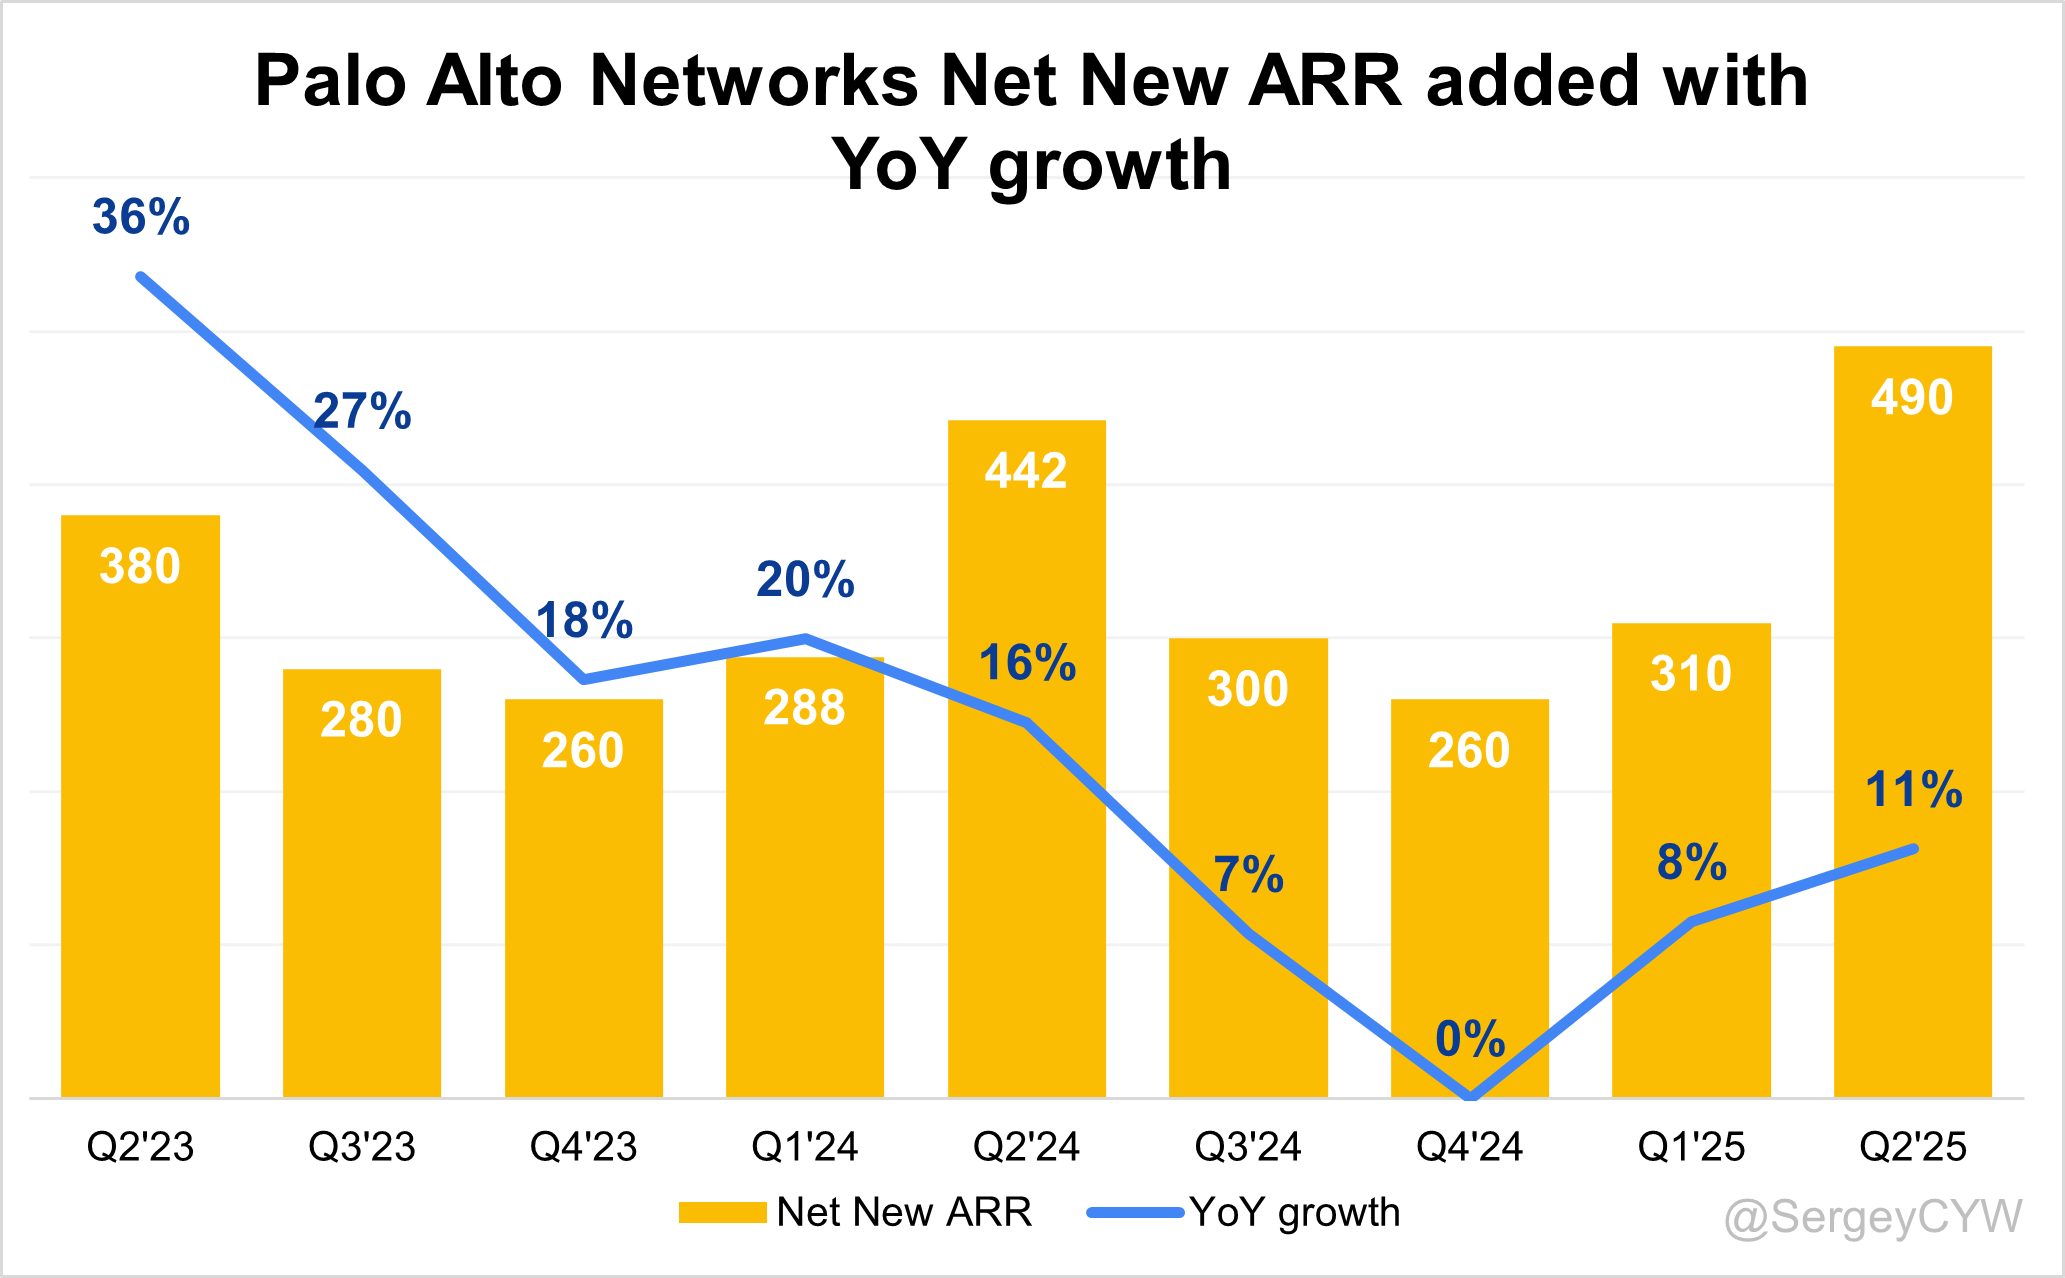
Palo Alto $PANW added $490 million in net new NGS ARR in Q2 2025, reflecting +11% YoY growth. This was the highest net new NGS ARR in the company’s history
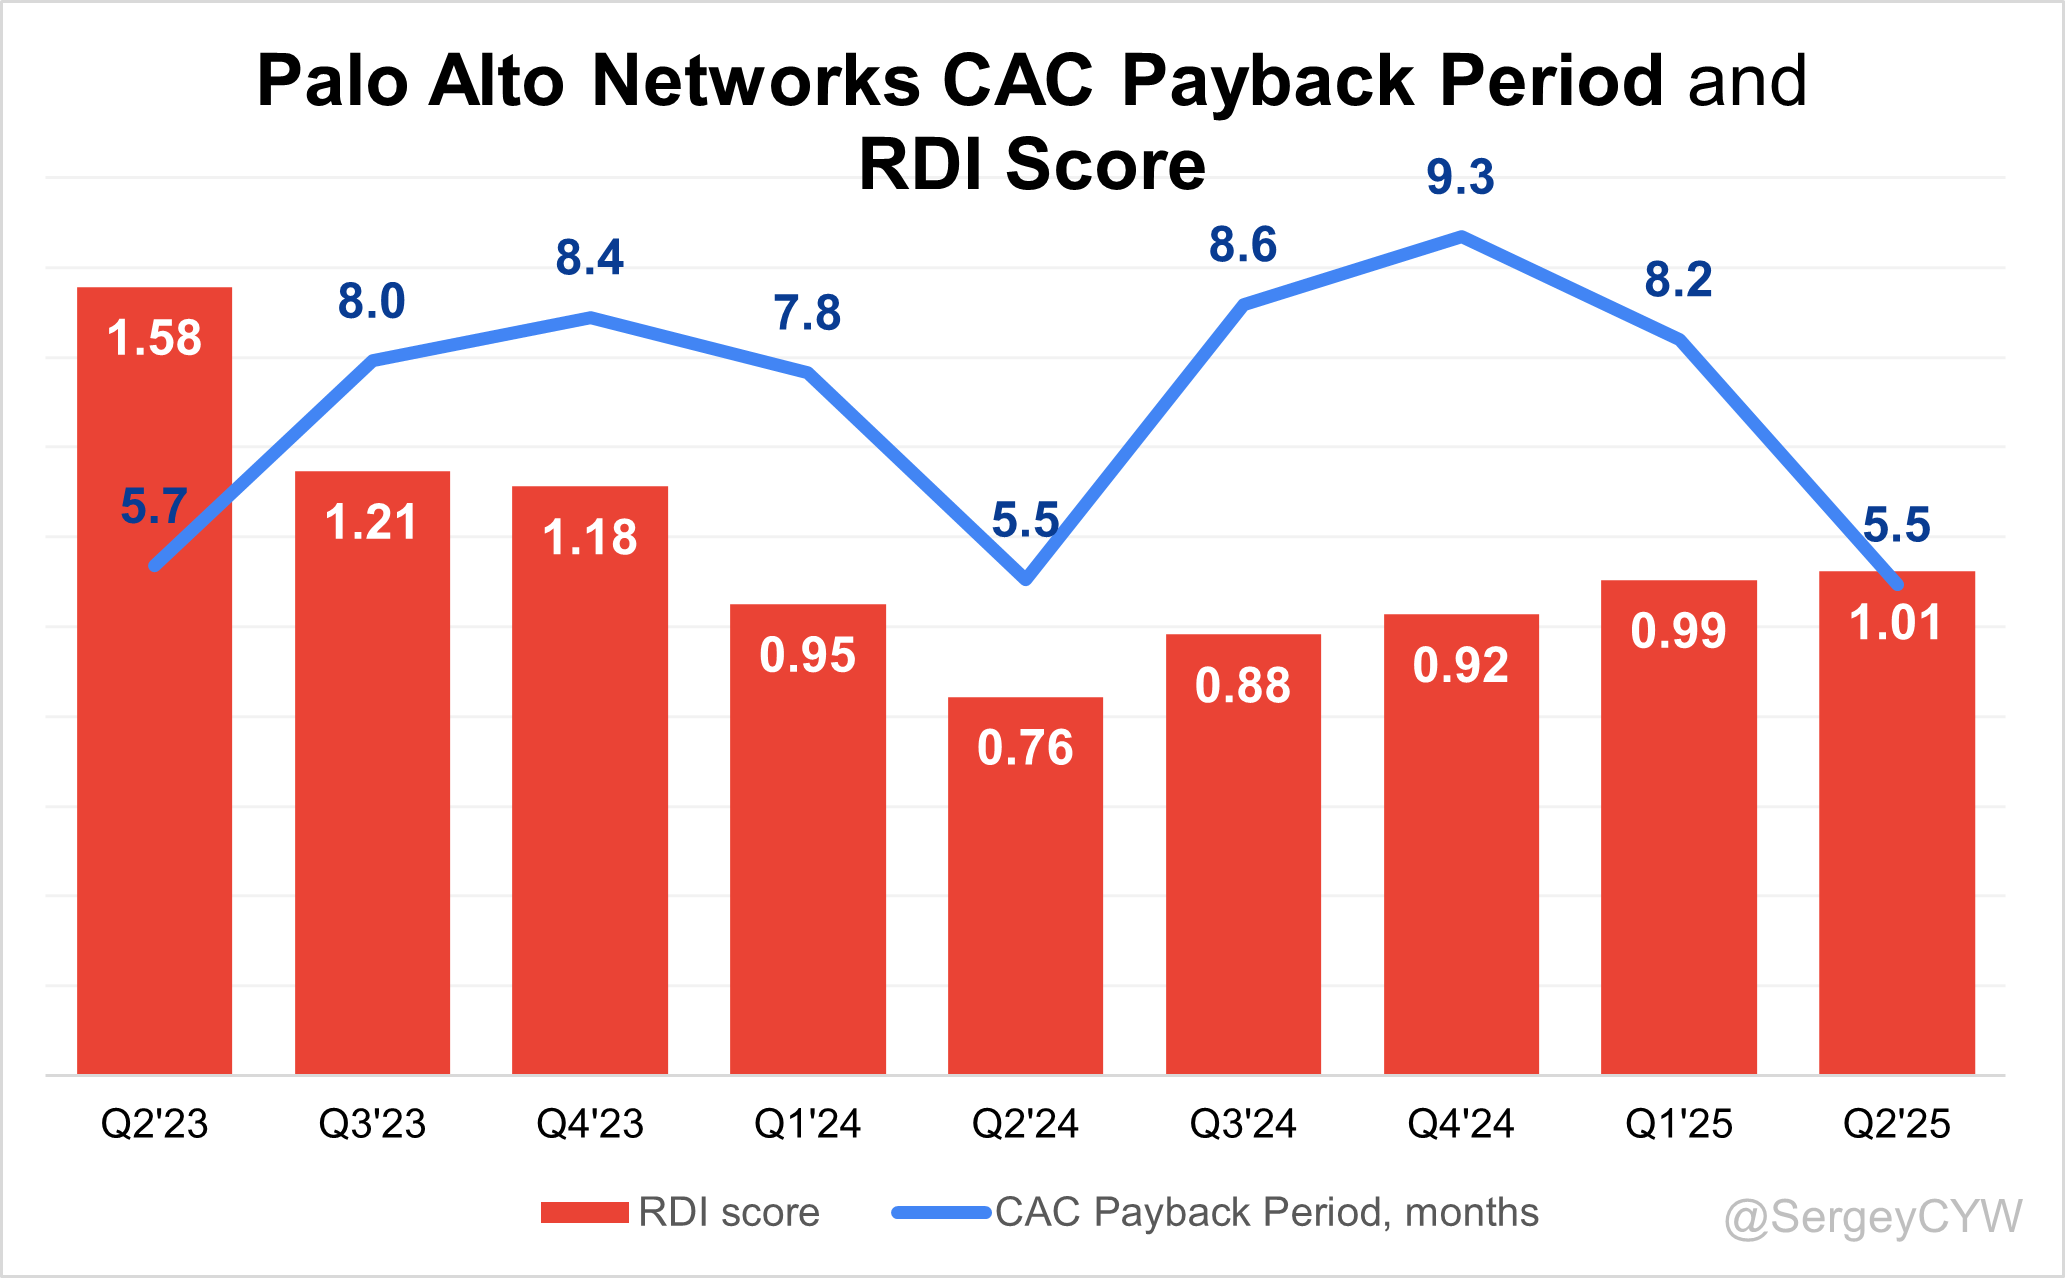
CAC Payback Period and RDI Score
$PANW’s return on S&M spending is 5.5. The CAC Payback Period has improved compared to the previous quarter and remains better than the average for SaaS companies (the median among those I track is 21.5 months).
The R&D Index (RDI Score) has significantly declined over the past two years and currently stands at 1.01 for Q2, which is below the median of 1.2 for the SaaS companies I monitor but above the industry median of 0.7.
An RDI Score above 1.4 is considered indicative of best-in-class performance. The low industry median of 0.7 highlights the importance of efficient R&D investment.
Profitability
Over the past year, $PANW Palo Alto margins has changed:
Gross Margin slightly decreased from 76.8% to 75.8%.
Operating Margin increased from 26.9% to 30.3%.
Free Cash Flow (FCF) Margin increased from 21.2% to 36.8%.

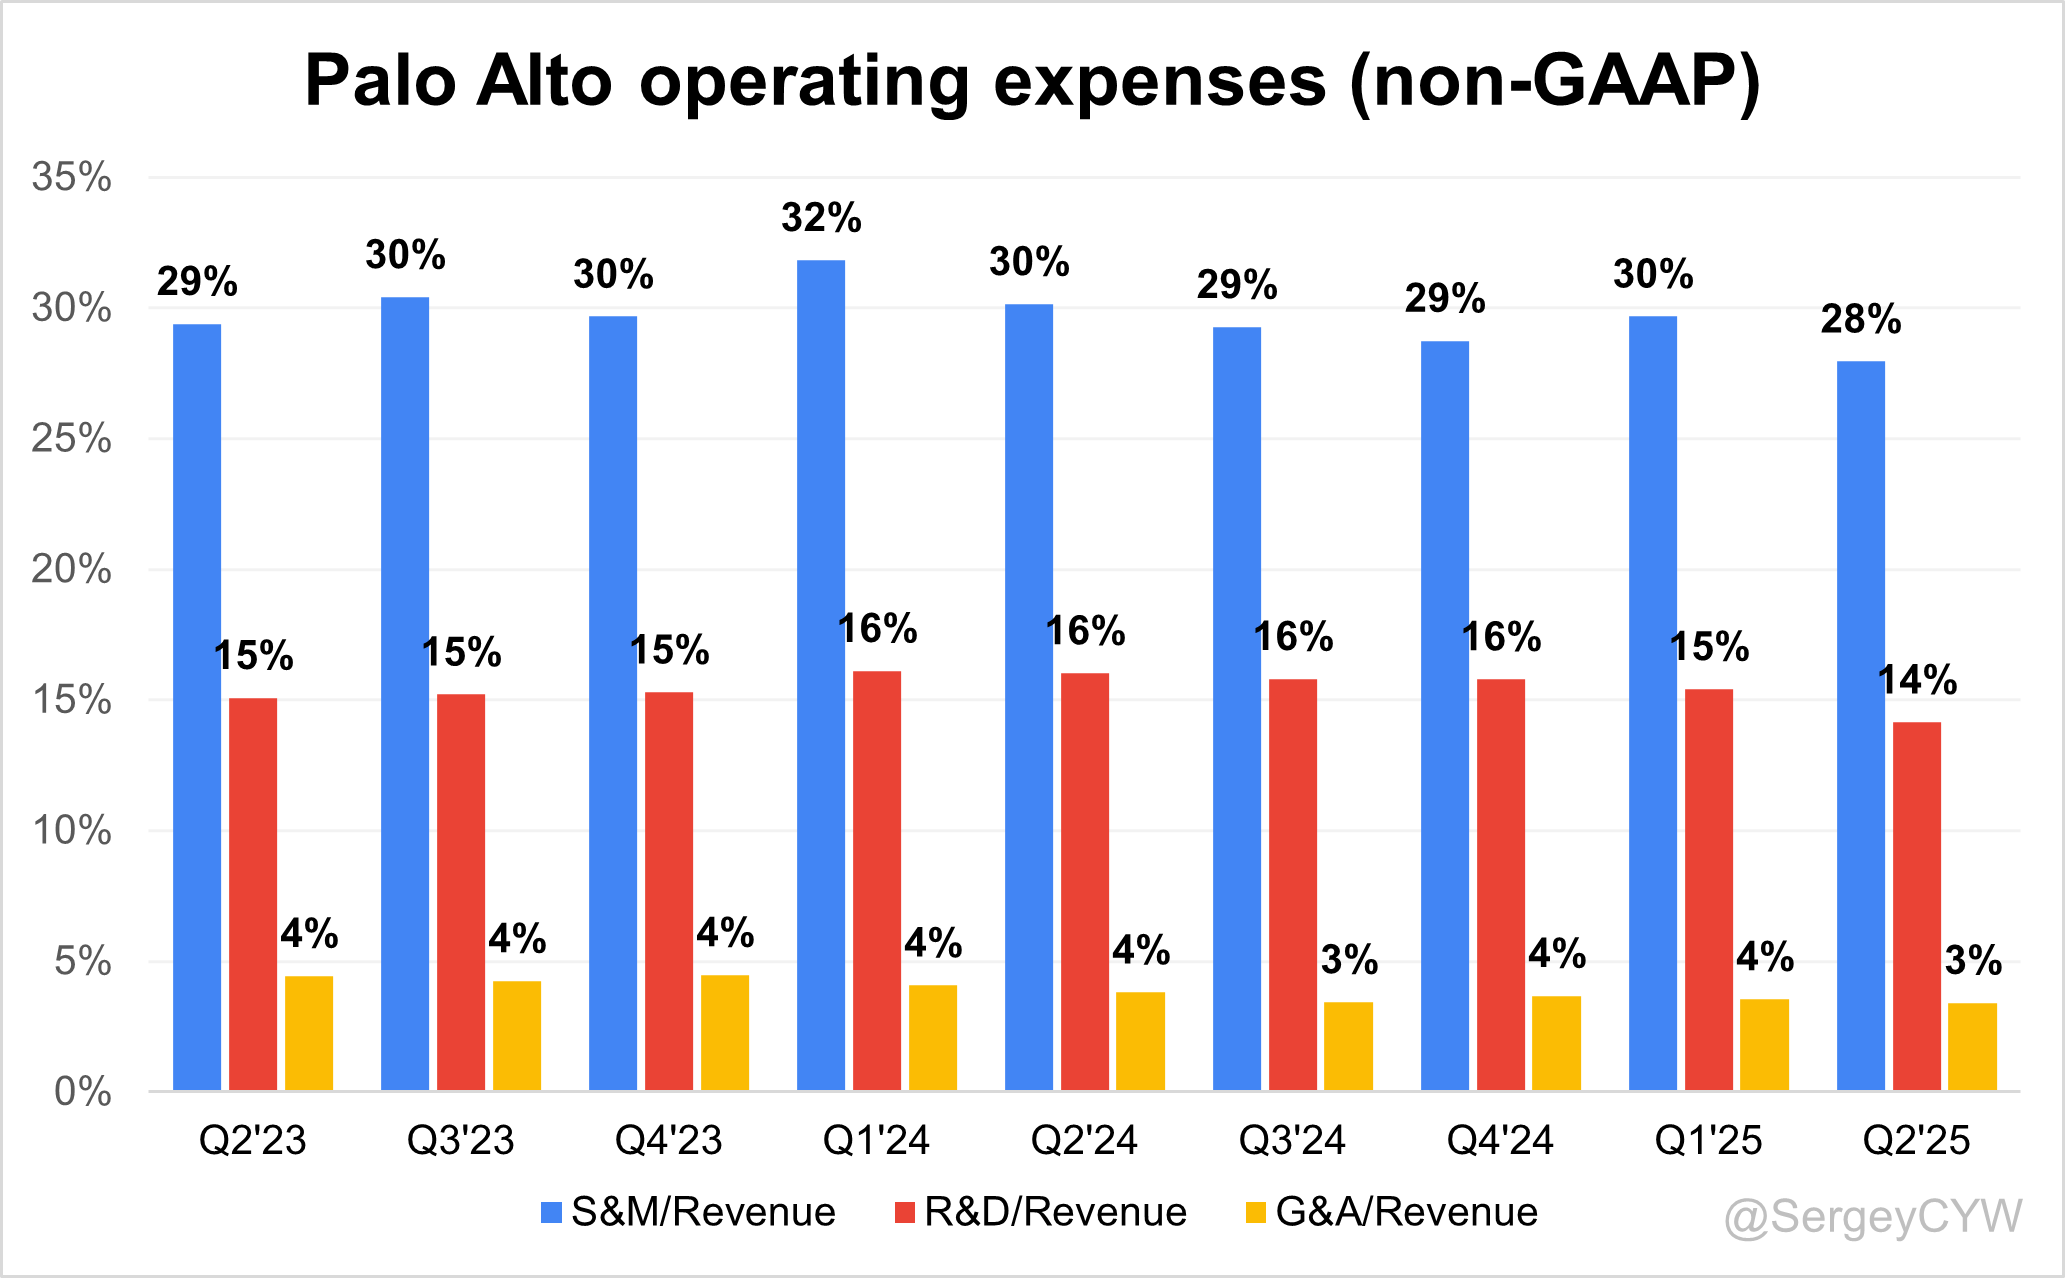
Operating expenses
$PANW’s non-GAAP operating expenses have slightly decreased, primarily due to reduced Sales & Marketing (S&M) spending, which declined from 29% two years ago to 28%.
R&D expenses remain high at 14%, as the company continues to invest in future growth through product enhancements and updates.
General & Administrative (G&A) expenses have slightly decreased and are now at a relatively low level of 3%.
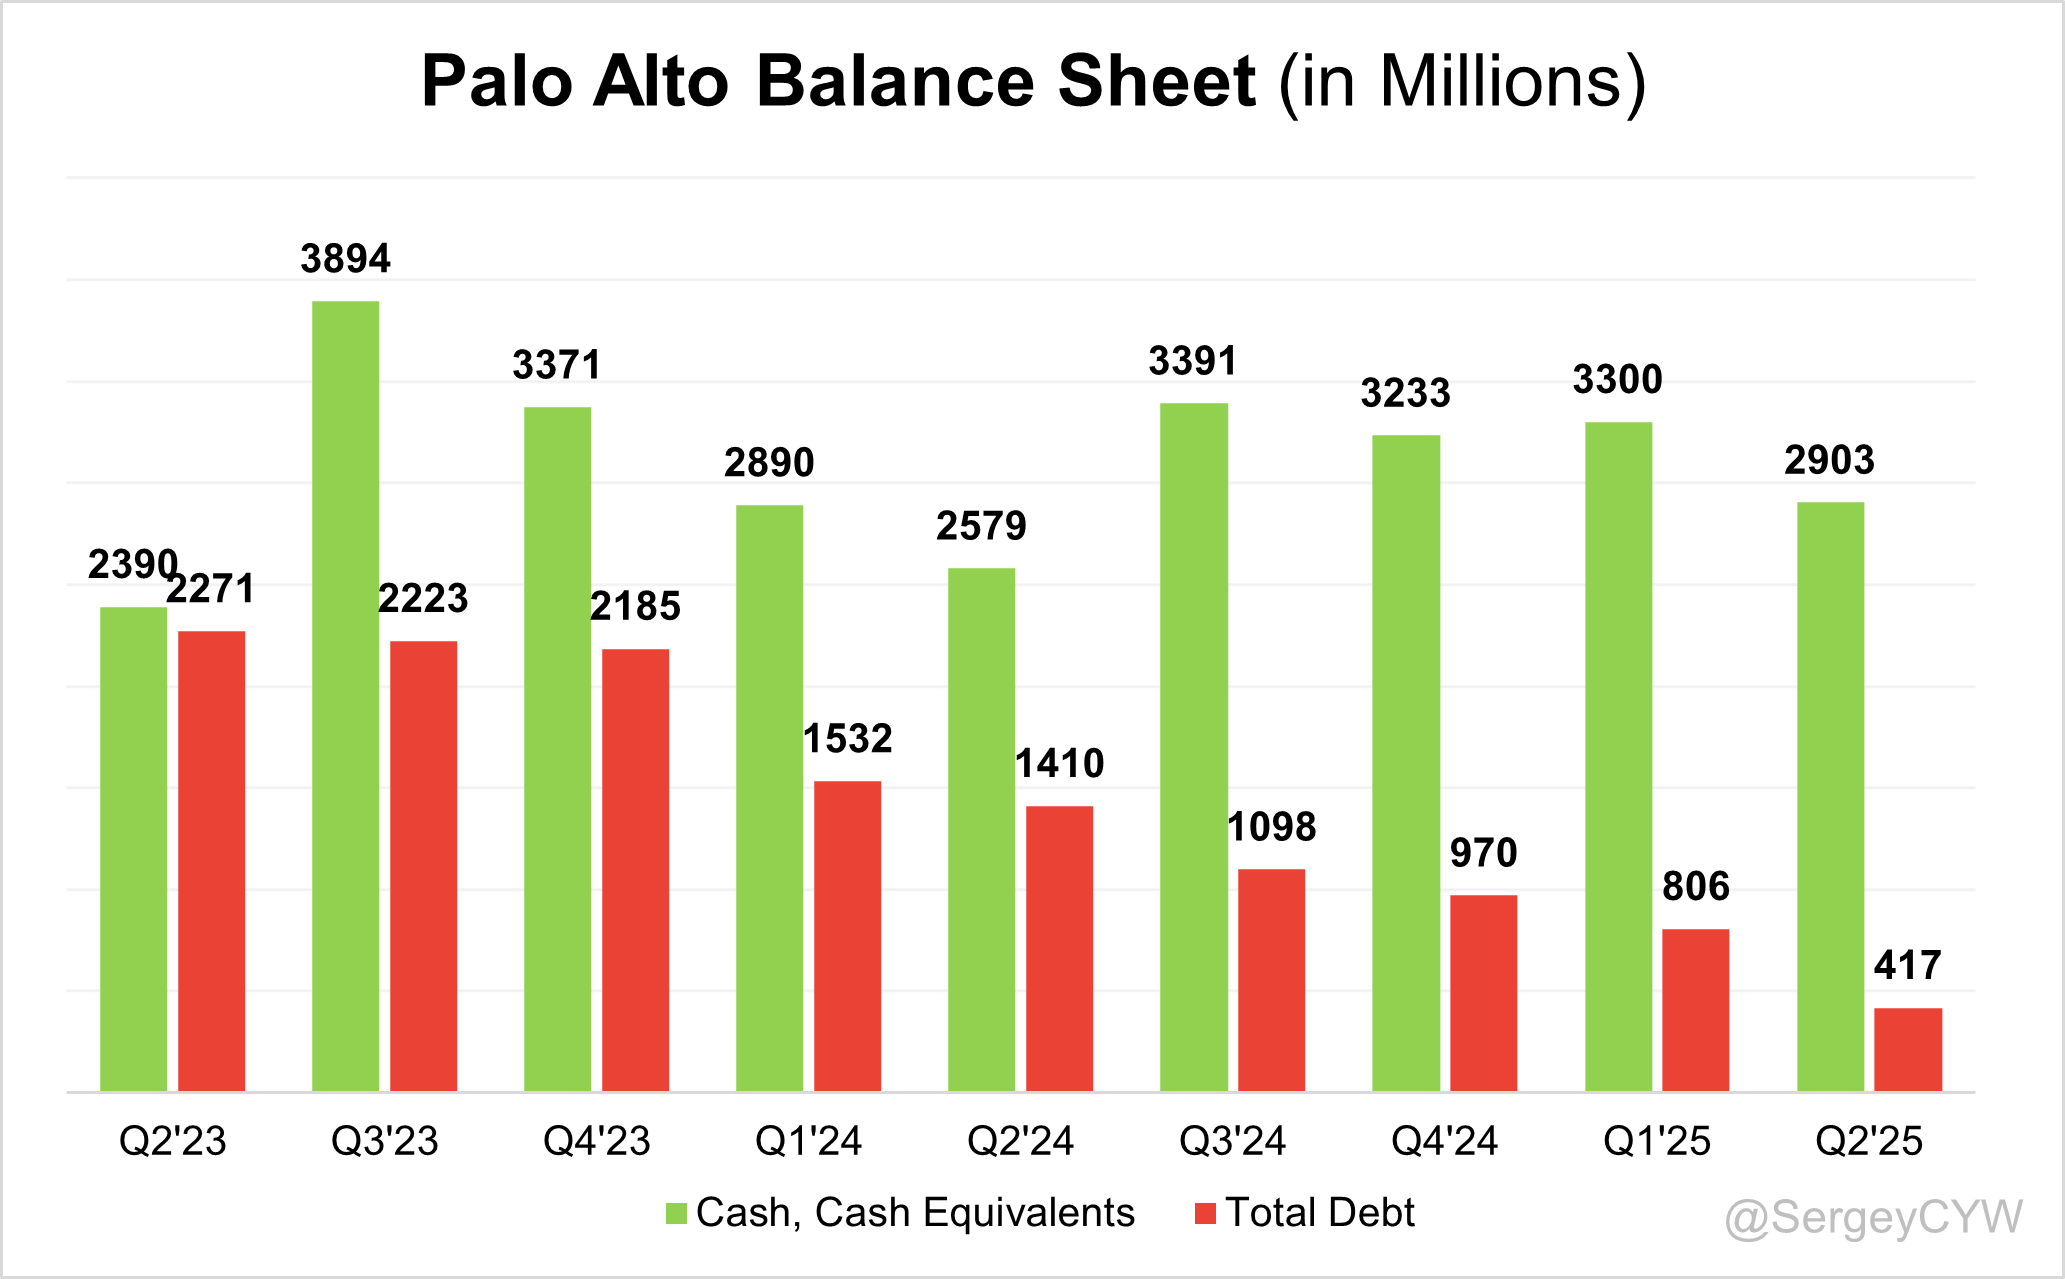
Balance Sheet
$PANW Balance Sheet: Total debt stands at $417M, while Palo Alto holds $2,903M in cash and cash equivalents, exceeding total debt and ensuring a healthy balance sheet.
Dilution
$PANW Shareholder Dilution: Palo Alto’s stock-based compensation (SBC) expenses have slightly increased over the past two quarters, reaching 15% of revenue in the last quarter, which is relatively low for SaaS companies.
Shareholder dilution remains elevated—despite a slight decline, the weighted-average number of basic common shares outstanding is still relatively high, having increased by 3.2% YoY.

9. Conclusion
$PANW is leaning into platformization — offering select products for free short-term to drive long-term customer lock-in. The strategy seems to be working: revenue growth has re-accelerated over the past year, reaching +15.8% YoY in Q2. It’s likely that the slowest point of revenue growth (+12.1% YoY in Q2 FY2024) is now behind us, as Palo Alto’s platformization strategy begins to show real traction.
The cybersecurity TAM is massive at around $110B, growing at roughly +14% CAGR. With only about 4% market share captured via $5.1B in ARR, Palo Alto Networks still has plenty of room to grow.
Palo Alto also maintains a wide economic moat, built on multiple reinforcing competitive advantages that form strong barriers to entry in the cybersecurity market — this remains the company’s most powerful defense in an increasingly competitive space.
Leading Indicators:
• RPO growth of +24.2% outpaced revenue growth
• Billings grew +6.5%, lower than revenue growth
• Net new ARR additions at record level +11 YoY, while NGS ARR grew +32.2% YoY, outpacing total revenue growth
Key Indicators
• CAC Payback Period improved to 5.5 months, which is much better than average
• RDI Score increased slightly to 1.01, but remains below the median of other SaaS companies I track
Management explained that billings growth lagging revenue growth reflects a shift in customer buying behavior toward annual payment structures and larger platformization deals with deferred payments. This temporarily dampened near-term billings growth, even as total RPO and ARR continued to expand.
Management also issued a strong forecast for the next quarter, pointing to a likely acceleration in revenue growth, supported by leading indicators — such as RPO and NGS ARR growth outpacing revenue, along with record net new ARR additions.
Improvements in both the CAC Payback Period and RDI Score indicate meaningful progress in operational efficiency. Customers generating $5M and $10M in ARR grew roughly 50% YoY, while $20M+ ARR customers increased by ~80% YoY. Platform customer net retention remained strong at around 120%, showing durable customer engagement and expansion.
The company trades at a Forward EV/Sales multiple above its historical average and near all-time highs. The PEG ratio is also elevated, but valuation appears reasonable relative to peers, given Palo Alto’s long-term growth outlook.
One concern is that gross margin has continued to decline over the past two years, though operating margin and FCF margin have both improved YoY, which is positive.
I’m currently on the sidelines with $PANW, but closely tracking the company’s performance. I believe cybersecurity remains one of the most attractive sectors for long-term investing.
Thank you for reading!
Follow me for more frequent updates on X/Twitter and Threads, and on LinkedIn. For visual infographics, check out Instagram, and for portfolio changes, follow me on SavvyTrader.
Disclaimer: This earnings review is for informational purposes only and does not constitute financial, investment, or trading advice.