


Netflix: Global Leader in Streaming with Room to Grow
Deep Dive into $NFLX: Valuation, Segment Growth, Key Metrics, Profitability, Expenses, Product Launches, Customer Acquisition, Financial Stability, SBC/Revenue, and Shareholder Dilution.

Netflix: Company overview
About Netflix
Netflix, Inc., founded in 1997 by Reed Hastings and Marc Randolph in Scotts Valley, California, is a leading global provider of entertainment services. Headquartered in Los Gatos, California, the company offers streaming of TV series, films, and games to over 301.6 million paid memberships across 190+ countries. Netflix produces and licenses a broad range of content across genres and languages, accessible via internet-connected devices including TVs, digital players, set-top boxes, and mobile devices. It operates under a dual-CEO structure with Greg Peters and Ted Sarandos, managing operations in Los Gatos and Los Angeles. Netflix ranks #117 on the Fortune 500 and delivered a staggering 3,693% total return during the 2010s, making it the top-performing stock in the S&P 500 that decade.
Company Mission
Netflix’s mission is "to entertain the world", emphasizing global accessibility, diverse storytelling, and high-quality streaming. Its strategy centers on delivering ad-free, premium video experiences tailored to various preferences and regions. The company adapts to technological shifts and user behavior while maintaining a strong focus on content quality and innovation.
Sector and Financial Performance
Netflix operates in the entertainment and media sector, positioned as the most-subscribed video streaming service globally. The company generated $40.17 billion in revenue and $9.27 billion in net income, reflecting strong profitability. With a workforce of around 14,000 employees, it produces $2.87 million in revenue per employee. Netflix has a price-to-earnings ratio of 56.30 and posted 15.65% YoY revenue growth, alongside 61.09% YoY net income growth, significantly outperforming sector benchmarks.
Competitive Advantages
Netflix leads through scale, content, and technology. Its expansive content library is enhanced by personalized recommendation algorithms that drive engagement. Operating in over 190 countries, Netflix enjoys a global footprint unmatched by most competitors. Original programming—such as globally recognized Netflix Originals—has helped build brand equity and viewer loyalty. Technical capabilities include seamless streaming in HD and 4K, broad device compatibility, and a continually evolving user interface. Ongoing investments in AI, partnerships, and content production help reinforce its edge.
Total Addressable Market (TAM)
Netflix targets a TAM of 700 million to 1 billion households worldwide, offering massive headroom beyond its current 301.6 million subscriber base. The global video streaming market was valued at $129.26 billion in 2024, with expected CAGR of 21.5% from 2025 to 2030. Within that, the SVoD segment is projected to grow at 6.90% annually, reaching $155.51 billion by 2029. Penetration in mature markets like North America is already high—approximately 75% of broadband households—while emerging regions continue to offer significant expansion opportunities through 2029.
Valuation
$NFLX Netflix is trading at a Forward EV/Sales multiple of 11.25, well above the median of 6.5. The company’s Forward EV/Sales multiple is near historical highs.

Powered by FinChat.io — get 15% off with affiliate link for Compounding Your Wealth readers.
$NFLX Netflix trades at a Forward P/E of 44.5, with a revenue growth of 12.5% YoY in the last quarter.
The EPS growth forecast for 2025 is 31%, with a 2025 PEG ratio of 1.4.
The EPS growth forecast for 2026 is 21% and 2026 P/E of 37.8, with a 2026 PEG ratio of 1.8.

Powered by FinChat.io — get 15% off with affiliate link for Compounding Your Wealth readers.
The PEG (Price/Earnings to Growth) ratio is a key tool for evaluating growth stocks, introduced by Peter Lynch.
PEG < 1: Undervalued – A ratio below 1 suggests the stock is undervalued. For example, if the P/E is 15 and earnings are expected to grow by 20%, the PEG would be 0.75, indicating a good buying opportunity.
PEG = 1: Fair Value – A PEG of 1 means the stock price matches its growth expectations, representing fair value.
PEG > 1: Overvalued – A PEG above 1 indicates the stock may be overvalued, as its price is higher than its projected growth rate, making it riskier.
Valuation comparison
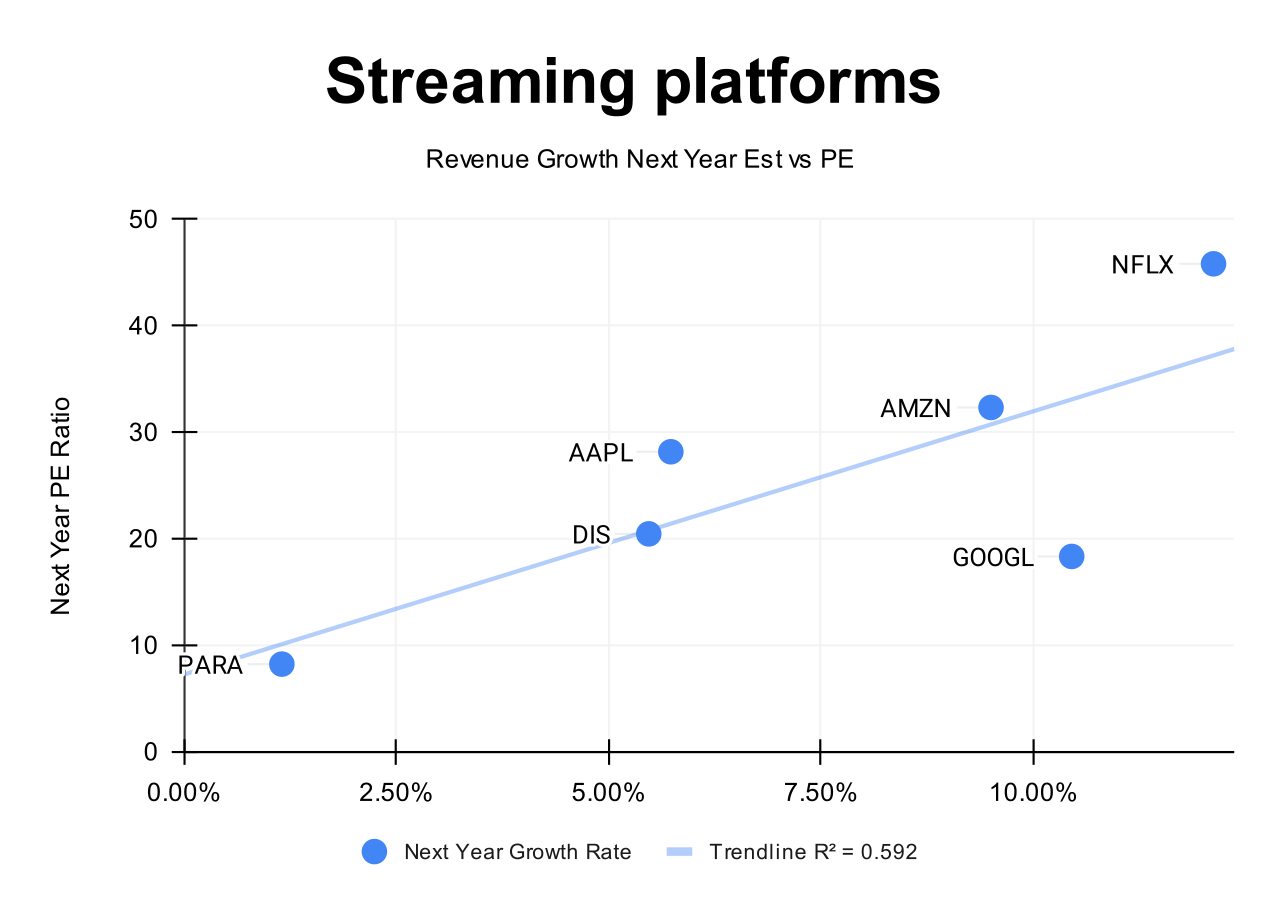
Analysts forecast +12.1% revenue growth for $NFLX in 2026. Based on this forecast, the valuation using the PE multiple appears trading at premium compared to other streaming platform companies that are profitable on a net income basis.
Analysts expect strong revenue growth, so let's examine the key metrics to determine whether these expectations are justified.
We'll evaluate the company's economic moat, which supports long-term revenue growth, analyze revenue trends and the forecast for next quarter, and identify key factors that could help the company exceed expectations and sustain future growth.
We'll assess the performance of key segments, the launch of new products and updates, customer acquisition growth, key financial metrics, financial stability, and margin trends.
Additionally, we'll review the SBC/Revenue ratio, shareholder dilution, and finally, draw conclusions on the company's outlook.
Economic Moat
Netflix holds several economic moats that create lasting advantages in the streaming industry. Here's a breakdown of the key components shaping its defensible position.
Economies of Scale
With over 301.6 million paid memberships in 190+ countries, Netflix achieves substantial economies of scale. It spreads high content costs across a vast global base, lowering cost per user while boosting investment power in content creation. Scale allowed Netflix to outcompete Blockbuster and now serves as a high barrier to entry for new players. Global hits like Squid Game generate asymmetric returns, while underperforming local titles have limited downside. Netflix has generated positive cash from operations since 2020, reinforcing the long-term financial strength of its scale.
Network Effects
Netflix demonstrates moderate network effects. A growing user base doesn’t inherently improve individual experience, but it enables deeper content investment. More subscribers fuel more content, which attracts more users—creating a self-reinforcing loop. Cultural hits like "Stranger Things" become social events, encouraging new sign-ups. The scale of viewership also enhances Netflix’s AI-driven personalization, leveraging massive datasets to refine content recommendations and greenlight high-potential projects, forming a data network effect.
Brand Identity
Netflix commands one of the strongest brands in streaming. Ranked the 39th most valuable brand globally in 2023 by Interbrand, with an estimated value of $17.9 billion, the company has become synonymous with on-demand entertainment. Phrases like "Netflix and chill" reflect cultural saturation. First-mover advantage and a relentless focus on customer experience helped cement its position. Strong brand equity allows Netflix to raise subscription prices without losing loyalty, and its iconic logo is instantly recognizable across markets.
Intellectual Property
Original content and proprietary technology form a growing competitive moat. Netflix owns the exclusive rights to a deep library of critically acclaimed originals, which act as a magnet for subscribers. Its patents around adaptive bitrate streaming and other delivery innovations protect its tech edge. Internal data models enhance user satisfaction through smarter recommendations. Netflix's IP isn’t just about content—it includes platform optimization, personalization, and analytics tools that are hard to replicate at scale.
Switching Costs
While switching between services is technically easy, Netflix has engineered psychological and experiential barriers. Features like tailored recommendations, seamless UI, and exclusive titles increase perceived value. Despite low theoretical switching costs, Netflix boasts a customer retention rate of 98.2% and a churn rate near 1.8%, highlighting high actual stickiness. Its focus on daily engagement, habit loops, and social features encourages continued use and discourages cancellation, even in a crowded streaming landscape.
Netflix possesses a narrow but effective economic moat with particular strength in economies of scale, brand identity, and intellectual property. While switching costs remain relatively low, Netflix's combination of moats has created a formidable competitive position in the streaming industry.
Revenue growth
The revenue growth of $NFLX Netflix slightly decreased to 12.5% YoY from 16.0% in the previous quarter. Considering the forecast for the next quarter, if the company exceeds its forecast by 1.2% as it did in Q1, Q2 growth would be approximately 16.8%, indicating acceleration in revenue growth.

Segments and Main Products
All of Netflix's revenue comes from streaming services. The streaming offering includes films, TV series, documentaries, and original programming across multiple genres and languages. Netflix provides various subscription tiers, differentiated by price, video quality (SD, HD, Ultra HD), and number of concurrent streams.
Netflix has expanded into ad-supported streaming to target more price-sensitive customers. A key feature of the platform is its proprietary recommendation algorithm, which drives engagement by enabling personalized content discovery.
Live sports is the company’s newest product expansion. In February 2024, Netflix signed a 10-year deal with WWE, with programming set to begin in January 2025. WWE content will be available in the US, UK, Canada, and Latin America.
Netflix permanently shut down its DVD-by-mail service on September 29, 2023, after 25 years of operation.
Main Products Performance in the Last Quarter
Streaming Platform
Netflix ended Q1 2025 with over 300 million paid households, representing 700+ million individual viewers. Engagement remains strong, with retention stable and churn around 1.8%, despite macro uncertainty. Content investments will ramp in H2, with major returns and more film titles in Q4. The platform remains underpenetrated in total addressable TV time, holding less than 10% of TV hours and 6% of consumer ad spend in markets served. Management believes there are hundreds of millions of untapped potential subscribers.
Live Events and Sports
Live events remain a small but high-impact part of the content slate. Although live view hours are low relative to total viewing, events like the Paul-Tyson fight, NFL on Christmas, and upcoming Taylor-Serrano rematch generate outsized engagement and acquisition effects. Netflix is expanding capabilities for live globally, with an eye on deals that make economic sense. It confirmed a second NFL Christmas Day game in 2025, signaling growing ambition in sports broadcasting.
Advertising
Advertising is a small but fast-growing revenue contributor. Netflix expects to double ad revenue in 2025 through a mix of upfronts, programmatic expansion, and scatter market activity. The rollout of its first-party ad-tech platform is live in the U.S. and Canada, with 10 more markets launching soon. New features include targeting based on life stage, interests, mood, and third-party segments. More advanced capabilities like ML-based optimization and new ad formats are scheduled for 2026–2027.
Netflix Originals and IP
Netflix continues to scale its IP with exclusive content and global hits. It announced new investment commitments of $1B in Mexico and $2.5B in Korean content, supporting localized storytelling and international expansion. Recent original hits, including Squid Game and Leo, demonstrate success across live-action and animation. Nine of the top 10 most-streamed movies in 2024 were animated, prompting investment in new titles like In Your Dreams (Q4 launch). Strong IP performance drives brand loyalty and cultural impact.
Video Games
Netflix games are a long-term growth bet, currently a small fraction of the content budget. Categories showing promise include narrative games based on IP (Squid Game Unleashed, Thronglets), mainstream hits (GTA), and kid-focused games like Peppa Pig. The company is exploring social party games next. Retention improves among users who engage with games. Future investment will scale gradually as Netflix learns to convert gaming engagement into subscriber value. The global games TAM is $140B+, excluding China and Russia.
Innovations and Product Updates
Netflix is launching a new TV homepage for better discovery, its first major UX overhaul in 10 years. Interactive search powered by generative AI is also in testing. Personalized ad targeting now uses proprietary audience data, with more measurement tools rolling out through 2026. AI tools are enhancing content production—example: Pedro Paramo's de-aging VFX cost less than The Irishman’s entire VFX budget, showing massive efficiency gains. AI will be used to reduce costs, improve quality, and expand access to advanced effects.
Revenue by Region
$NFLX Netflix’s revenue distribution by region has remained relatively stable over the past two years. The company’s largest regions are UCAN and EMEA, contributing 44% and 32% of total revenue, respectively.
Revenue growth in UCAN has slowed to 9% YoY, while EMEA continues to grow steadily at 15% YoY. Growth in the APAC region has accelerated significantly to 23% YoY, whereas LATAM lags behind with revenue growth of only +8% YoY.

Market Leaders
According to Statista, as of the end of 2024, Netflix is the second most popular SVOD (subscription video on demand) platform in the U.S., holding a market share of 21%. It is slightly behind Amazon Prime, which leads with a market share of 22%.

Subscriber Growth
Netflix ended Q1 2025 with over 300 million paid households, reflecting continued global expansion. Management reaffirmed that despite strong penetration in some regions, the company remains a minority player in its total addressable market. The platform currently reaches less than 10% of global TV viewing hours and accounts for only 6% of consumer ad spend in served markets. Leadership reiterated confidence in signing up hundreds of millions more subscribers over time. Q1 net additions benefited from seasonal strength and follow-through from high-profile Q4 events like Squid Game and the NFL partnership.
Retention metrics remain stable and strong, with no material deterioration reported despite macro uncertainty. Netflix observed that users acquired during major Q4 2024 events—such as the Tyson-Paul fight and Christmas Day NFL games—have shown retention trends consistent with subscribers acquired through other flagship titles. The company highlighted a low churn rate near 1.8%, underpinned by growing value perception, multi-tiered pricing, and personalized user experiences. Retention strength has held across geographies, supporting sustainable membership growth.
Engagement remains healthy, with no signs of deterioration in planned mix or watch time. Leadership pointed to continued strength across pricing tiers, including solid traction for the $7.99 ad-supported plan in North America. The company highlighted that even its most viral titles contribute less than 1% of total viewing, emphasizing the importance of content discovery and personalization to drive long-tail consumption. Netflix's expanding investment in recommendation engines, a redesigned homepage, and interactive generative search is aimed at deepening engagement and increasing title visibility across its extensive library. AI-enhanced discovery is positioned as a core lever for sustained engagement uplift.
Profitability
Over the past year, $NFLX Netflix has improved its margins:
· Gross Margin rose from 46.8% to 50.1%.
· Operating Margin increased from 28.1% to 31.7%.
· FCF Margin increased from 22.8% to 25.2%.
· Net Margin increased from 24.9% to 27.4%.

Operating expenses
$NFLX Netflix slightly reduced operating expenses by cutting down on G&A costs over the past two years, with S&M expenses remaining at 7% of revenue.
The R&D share remains at 8%, the company continues to actively invest in its future growth through product updates.
G&A expenses are at 4% and have slightly decreased.

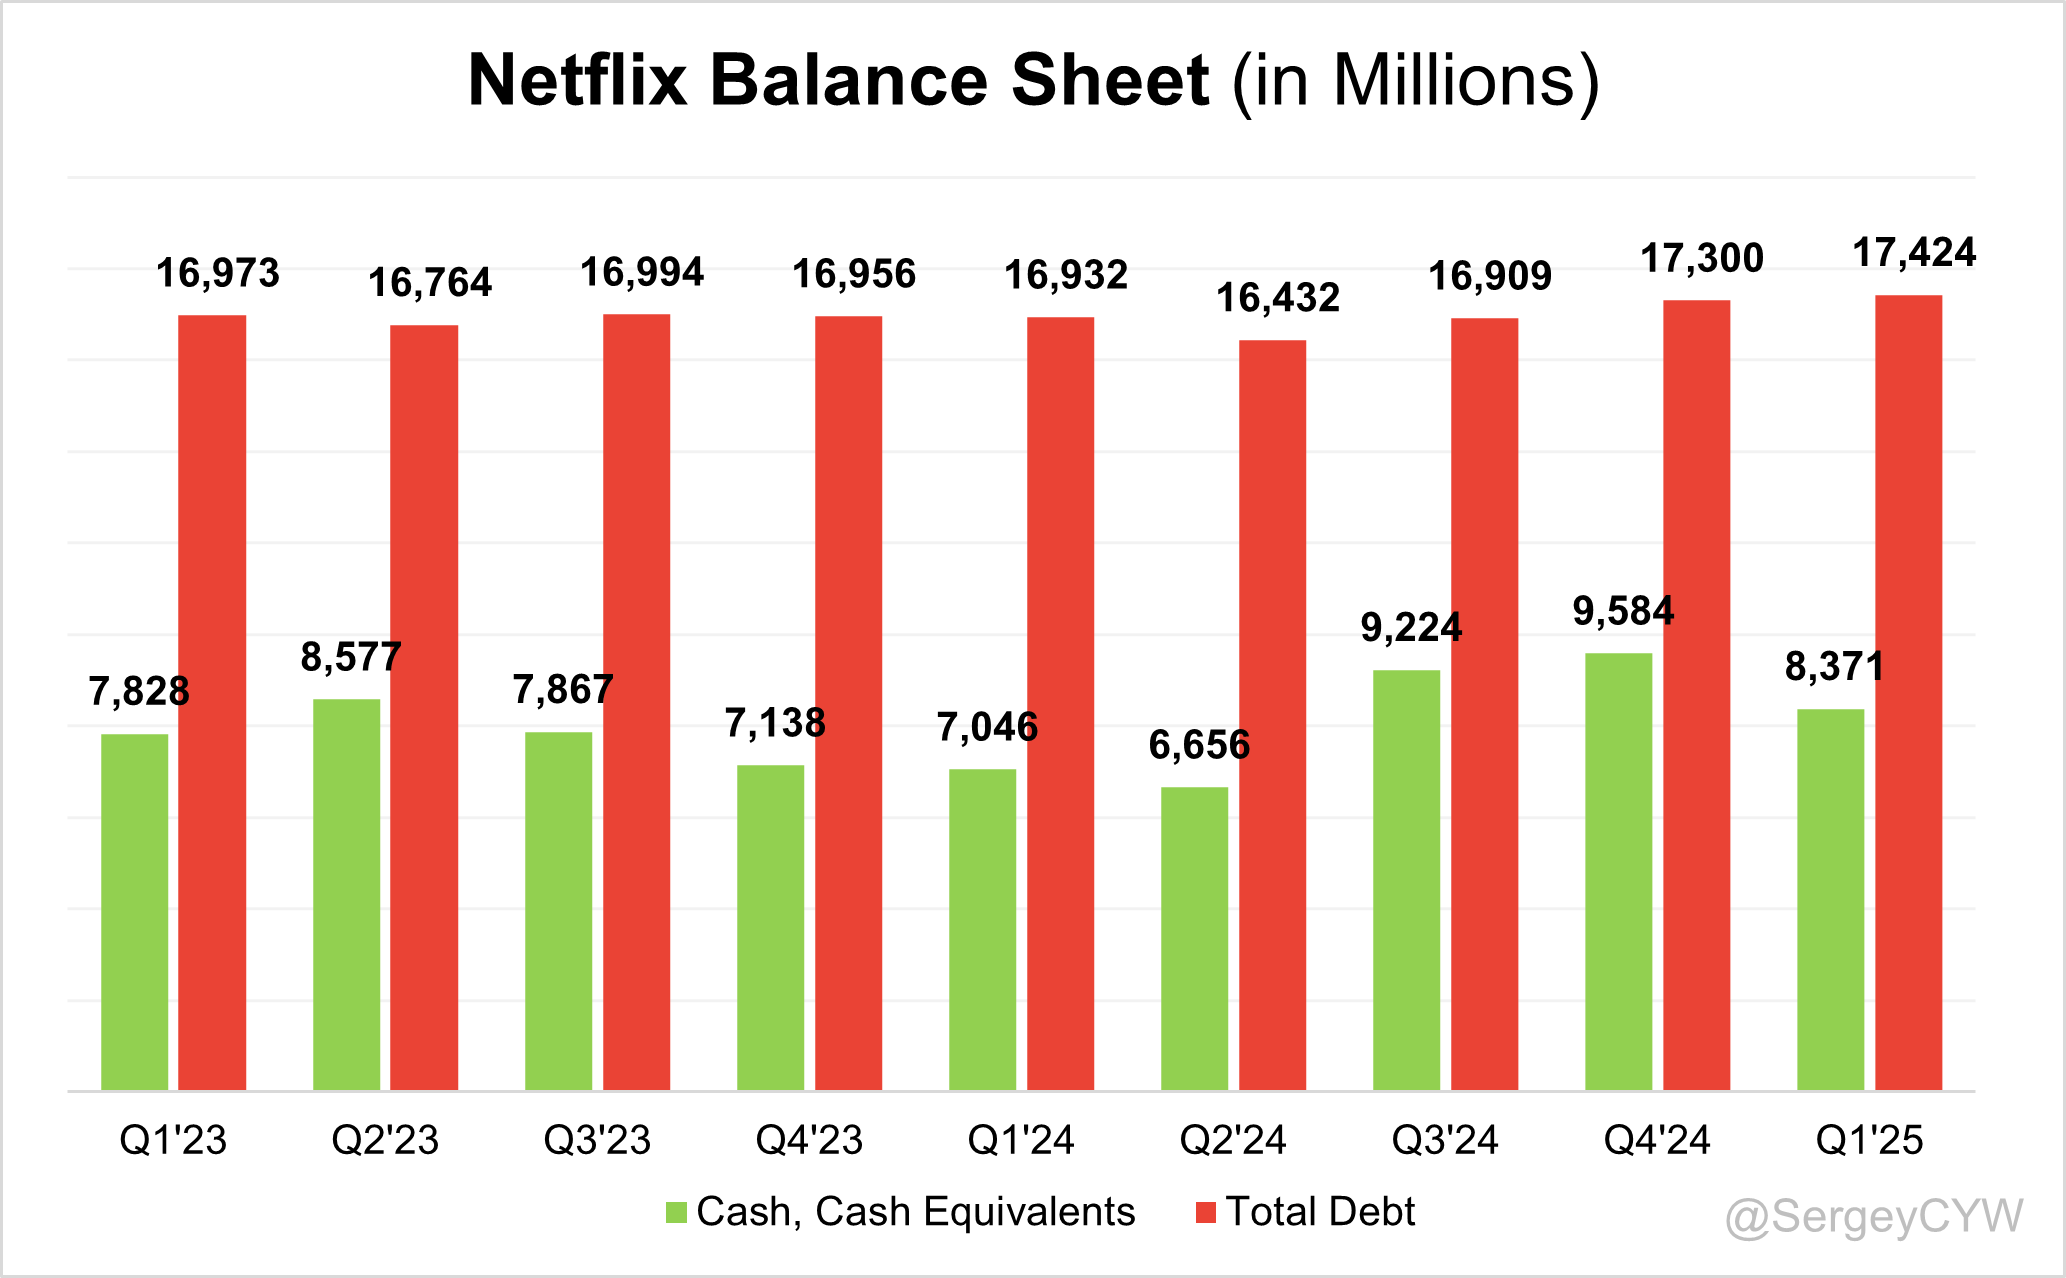
Balance Sheet
$NFLX Balance Sheet: Total debt stands at $17,424 million, while Netflix holds $8,371 million in cash and cash equivalents, which is significantly lower than the total debt level.
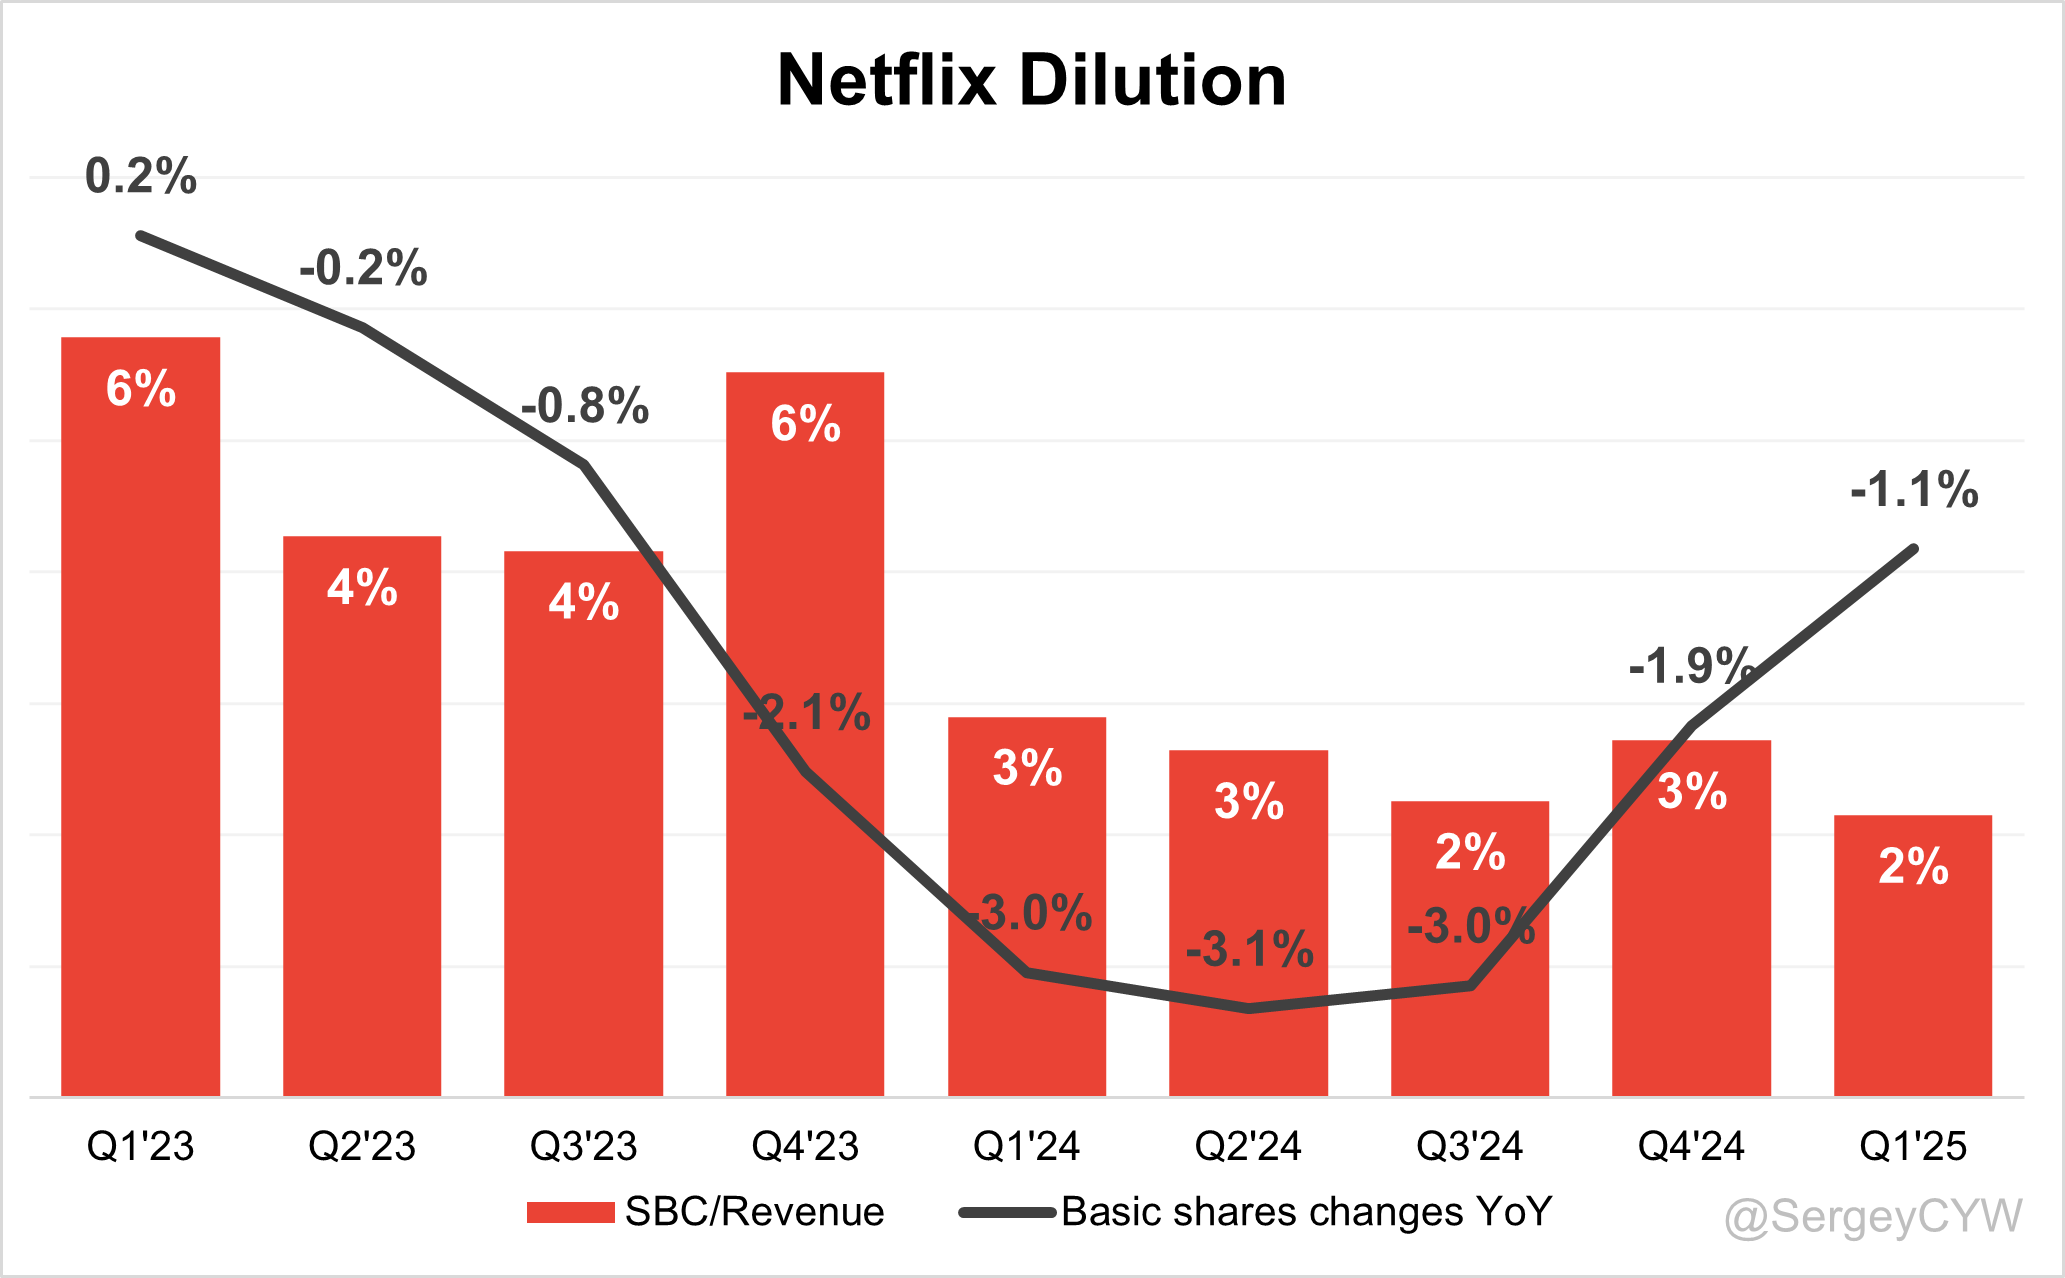
Dilution
$NFLX Shareholder Dilution: Netflix’s stock-based compensation (SBC) expenses have decreased over the past year and now account for 2% of revenue.
Shareholder dilution remains well-controlled, with the weighted-average number of basic common shares outstanding decreased by -1.1% YoY.
Netflix is actively buying back shares. Throughout 2024, the company repurchased 9.9 million shares for $6.2 billion. In Q1 2025, Netflix repurchased 3.7 million shares for a total of $3.5 billion. The pace of buybacks accelerated meaningfully quarter-over-quarter, with Q1 2025 activity accounting for over half the annual 2024 volume in dollar terms.
Conclusion:
Although $NFLX Netflix’s revenue growth slowed compared to Q4 2024, the company exceeded its revenue forecast and provided a strong outlook for the next quarter, with revenue growth expected to accelerate in Q4.
Netflix is launching a new TV homepage to improve content discovery. Interactive search powered by generative AI is currently in testing. AI tools are also being used to enhance content production, reduce costs, and improve quality.
The company has improved its profitability, with its operating margin rising to 31.7%.
Netflix is the second most popular SVOD (subscription video on demand) platform in the U.S., slightly behind Amazon Prime.
Netflix continues to strengthen its international presence by offering localized content. Revenue growth in the EMEA region (the company’s second-largest market) is outpacing total revenue growth, while APAC revenue growth has significantly accelerated and is well above the company’s overall growth rate.
Netflix no longer reports paid memberships at the end of the period, which makes it harder to track trends in user acquisition efficiency.
The company’s valuation based on the Forward P/E multiple is near historical highs, but analysts project a high TAM growth rate of 21.5% CAGR. The revenue growth forecast for 2025 stands at 16.3% YoY, indicating an acceleration in top-line growth, and the PEG ratio remains at an acceptable level.
Thank you for reading!
Follow me for more frequent updates on X/Twitter and Threads, and on LinkedIn. For visual infographics, check out Instagram, and for portfolio changes, follow me on SavvyTrader.
Disclaimer: This earnings review is for informational purposes only and does not constitute financial, investment, or trading advice.