


Microsoft: Dominating Cloud, AI, and Enterprise Software
Deep Dive into $MSFT: Valuation, Segment Growth, Key Metrics, Profitability, Expenses, Product Launches, Customer Acquisition, Financial Stability, SBC/Revenue, and Shareholder Dilution.

Microsoft: Company overview
About Microsoft
Microsoft Corporation is an American multinational technology conglomerate headquartered in Redmond, Washington, founded in 1975 by Bill Gates and Paul Allen. The company has evolved from a software startup focused on BASIC interpreters for the Altair 8800 to become the largest software maker and one of the most valuable public U.S. companies. Microsoft operates in more than 100 countries worldwide and generates revenue through developing, licensing, and supporting software products and services, designing and selling hardware devices, and delivering online advertising. In January 2024, Microsoft became the most valued publicly traded company.
Company Mission
Microsoft's mission statement is "to empower every person and every organization on the planet to achieve more". The company's vision focuses on democratizing AI, making it accessible and beneficial for everyone. Microsoft's mission reflects its commitment to leveraging technology for universal empowerment, driving core values and business decisions across all operations. The mission emphasizes Microsoft's role as a global technology leader dedicated to creating products and services with positive impact on people's lives.
Sector and Business Operations
Microsoft operates across multiple technology sectors including software development, cloud computing, hardware manufacturing, and gaming. The company's primary revenue streams include operating systems for computing devices, servers, and phones; server applications for distributed computing; productivity applications; business solution applications; and online advertising. Microsoft offers cloud-based solutions through shared computing resources in centralized data centers, with services including Office 365, Microsoft Dynamics CRM Online, Windows Azure, Bing, Skype, Xbox LIVE, and Yammer. The company recorded over $69 billion in revenue during the second financial quarter of 2025.
Competitive Advantage
Microsoft maintains what Warren Buffett calls a "strong moat" - competitive advantages protecting it from rivals and enabling large profits. The company's competitive advantages include economies of scale, network effects, strong brand recognition, intellectual property including patents and proprietary software code, and regulatory positioning. Morningstar assigns Microsoft a wide economic moat based on competitive success of Office and cloud products. Microsoft's dominance continues with Windows holding the top spot in the personal computer market, while the company has successfully transitioned to cloud computing with Microsoft Azure competing against Amazon and IBM.
Total Addressable Market (TAM)
Small and Medium Commercial (SMC) Market: Microsoft estimates the TAM for Small and Medium Commercial customers in FY25 at $661 billion, with $467 billion specifically in cloud solutions. The SMC segment targets companies with fewer than 3,000 employees and demonstrates robust growth trajectory with a compound annual growth rate of 15% over the next four years, while cloud solutions within this segment are projected to grow even faster at 20% CAGR.
Cloud Computing Market: The broader cloud computing market presents Microsoft's largest TAM opportunity. The market is projected to reach $1.40 trillion by 2030, growing at a 16.8% CAGR from 2023 to 2030. Microsoft Azure has captured 23% market share (up from 21% in the previous quarter), positioning the company to benefit significantly from this expanding market.
AI Services Market: Microsoft's AI services represent the fastest-growing component of its TAM. The AI services industry is expected to sustain a 36% CAGR through the middle of the next decade, representing a growth opportunity that extends beyond the current infrastructure boom. Microsoft's Q2 2025 results showed accelerating AI services growth, with over 65% of Fortune 500 companies already using Azure OpenAI service.
Additional Market Segments: Microsoft operates across several other expanding markets with significant CAGR projections:
Team collaboration software market: Expected to reach $40.79 billion by 2028 with a 13.2% CAGR from 2022 to 2028
Cybersecurity market: Projected to reach $657.02 billion by 2030 at a 12.8% CAGR from 2022 to 2030
Internet advertising market: Expected to expand to $4.68 trillion by 2031 with a 29.9% CAGR during 2023-2031
The combined TAM across Microsoft's core segments exceeds $2 trillion, with cloud and AI services driving the highest growth rates at 16-36% CAGR respectively.
Valuation
$MSFT is trading at a forward EV/Sales multiple of 11.03, well above the median of 8.26 and near historical highs. For context, it bottomed at 7.5 at the end of 2022 — a rise of over +50% since then.
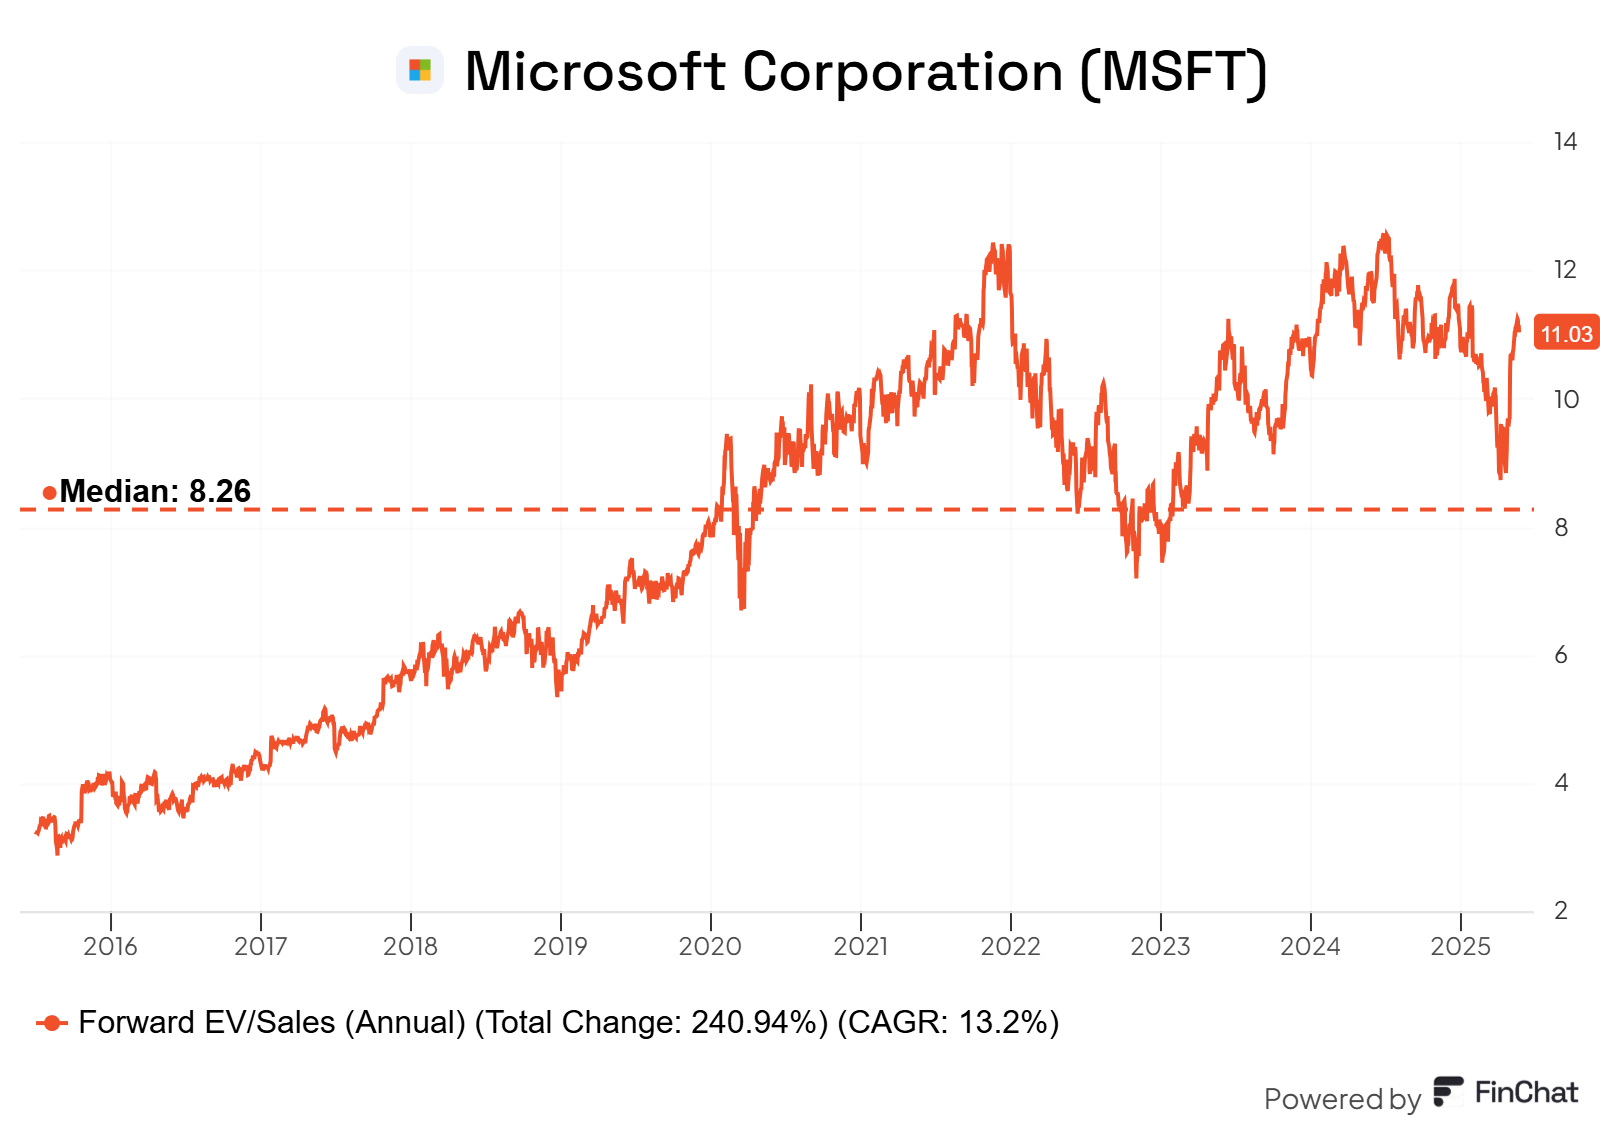
Powered by FinChat.io — get 15% off with affiliate link for Compounding Your Wealth readers.
$MSFT trades at a forward P/E ratio of 31.2, above the median of 26.23, with revenue growth of 13% YoY in the latest quarter.
The EPS growth forecast for 2026 is 12.9%, with a P/E of 33.1, resulting in a 2026 PEG ratio of 2.6.
For 2027, EPS growth is projected at 16.9%, with a P/E of 29.3 and a 2027 PEG ratio of 1.7.
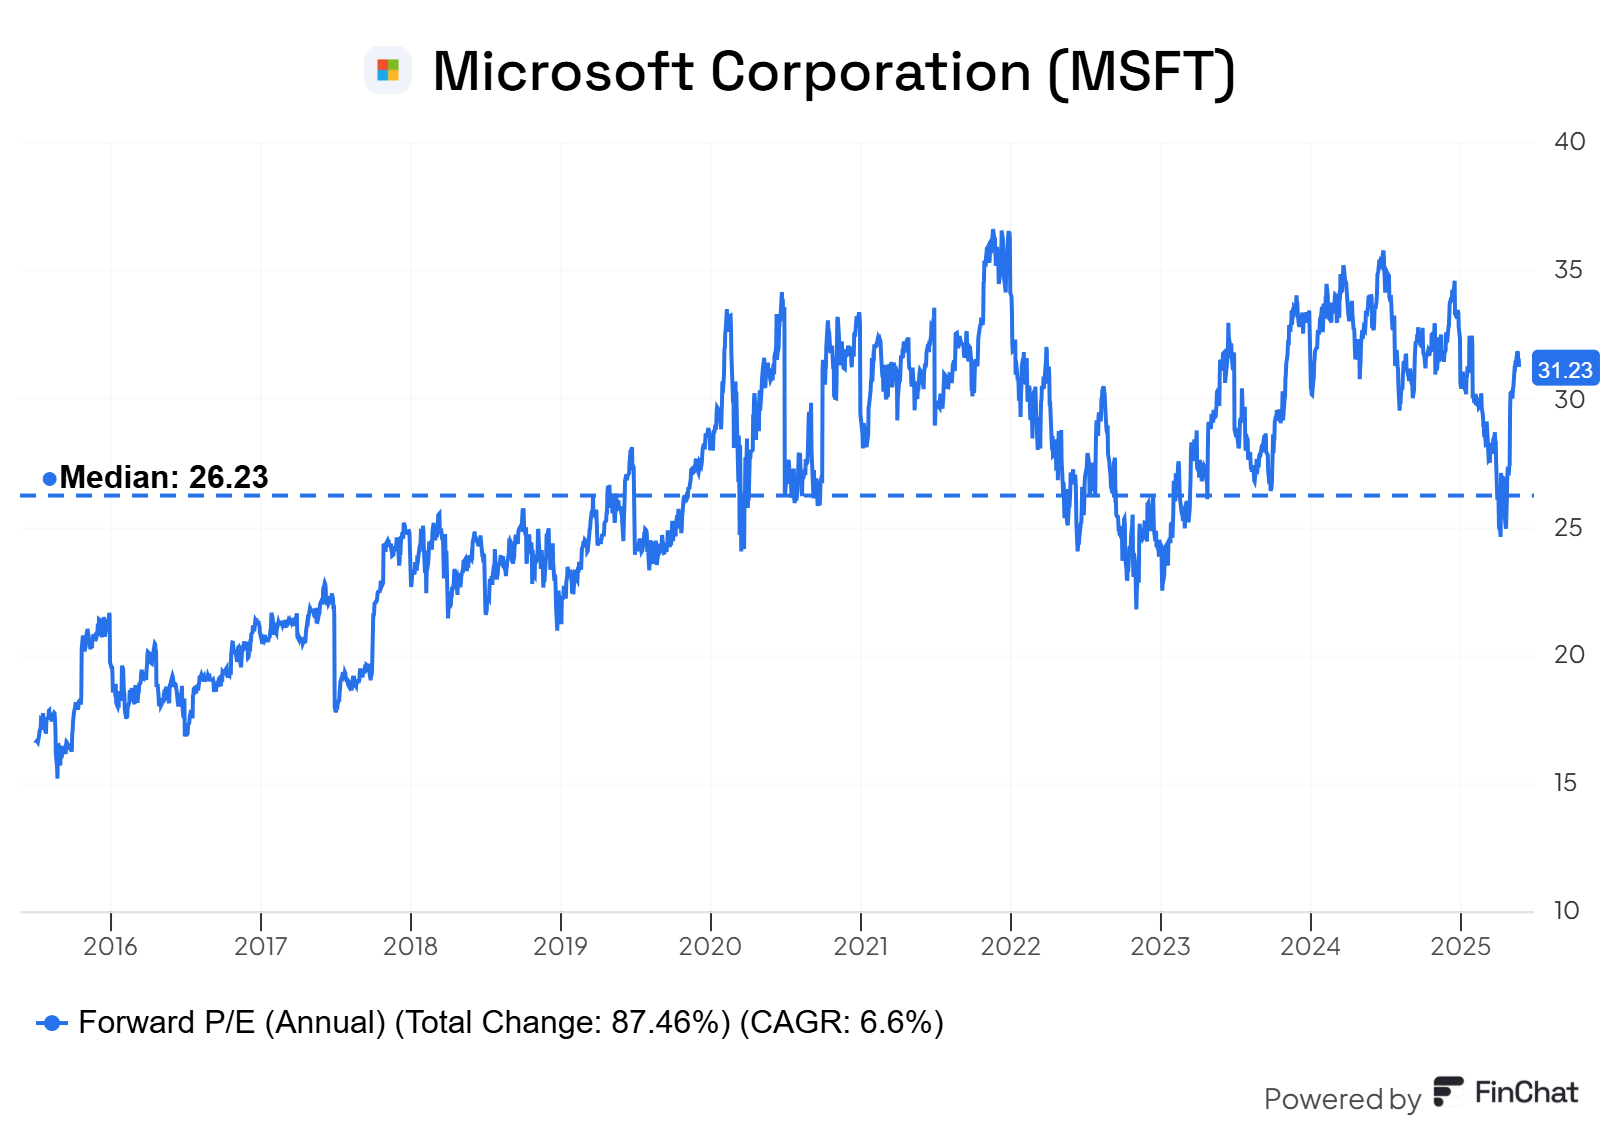
Powered by FinChat.io — get 15% off with affiliate link for Compounding Your Wealth readers.
The PEG (Price/Earnings to Growth) ratio is a key tool for evaluating growth stocks, introduced by Peter Lynch.
PEG < 1: Undervalued – A ratio below 1 suggests the stock is undervalued. For example, if the P/E is 15 and earnings are expected to grow by 20%, the PEG would be 0.75, indicating a good buying opportunity.
PEG = 1: Fair Value – A PEG of 1 means the stock price matches its growth expectations, representing fair value.
PEG > 1: Overvalued – A PEG above 1 indicates the stock may be overvalued, as its price is higher than its projected growth rate, making it riskier.
Valuation comparison
Analysts forecast $MSFT revenue growth of +16.2% in 2025 and +13.5% in 2026. Based on this outlook, the valuation using the P/E multiple appears to be fair valued compared to other Big Tech companies.

Analysts expect solid revenue growth, so let's examine the key metrics to determine whether these expectations are justified.
We'll evaluate the company's economic moat, which supports long-term revenue growth, analyze revenue trends and the forecast for next quarter, and identify key factors that could help the company exceed expectations and sustain future growth.
We'll assess the performance of key segments, the launch of new products and updates, customer acquisition growth, key financial metrics, financial stability, and margin trends.
Additionally, we'll review the SBC/Revenue ratio, shareholder dilution, and finally, draw conclusions on the company's outlook.
Economic Moat
Microsoft's economic moat represents one of the strongest competitive advantages in the technology sector, with Morningstar assigning Microsoft a "wide economic moat" rating based on multiple reinforcing competitive advantages that protect the company from rivals and enable sustained profitability.
Economies of Scale
Microsoft demonstrates exceptional economies of scale across its global operations, serving over one billion Office users worldwide while maintaining industry-leading margins. The company's net profit margin of 23.5% exceeds its five-year average, while its return on invested capital (ROIC) of 26.4% significantly outpaces its weighted average cost of capital of 6.8%. Microsoft's scale advantages manifest through its ability to spread development costs across massive user bases, negotiate favorable supplier terms, and leverage infrastructure investments across multiple product lines. The company's Windows operating system holds nearly 75% market share in desktop environments, creating substantial scale benefits that smaller competitors cannot replicate.
Network Effect
Microsoft benefits from powerful network effects that increase product value as more users join the platform. Microsoft Teams exemplifies this advantage, where communication and collaboration capabilities become more valuable as additional users participate in the network. The Office suite creates positive feedback loops through document sharing, collaboration features, and standardized file formats that attract and retain users. Microsoft's ecosystem integration means that as more organizations adopt Office 365, the platform becomes increasingly essential for business communication and productivity. The network effect strengthens over time, with over 65% of Fortune 500 companies already using Azure OpenAI services, creating momentum for further adoption.
Brand Strength
Microsoft maintains exceptional brand recognition and trust built over decades of market leadership. The company's brand represents reliability, compatibility, and industry standards across multiple technology segments. Microsoft Office has become an industry standard, with the brand synonymous with productivity software globally. The Windows brand commands similar recognition in operating systems, while Azure has rapidly established credibility in cloud computing. Brand strength provides pricing power and customer loyalty, with enterprises often preferring Microsoft solutions due to perceived reliability and comprehensive support. The brand advantage extends internationally, helping Microsoft compete effectively against local alternatives in global markets.
Intellectual Property
Microsoft's intellectual property portfolio creates substantial barriers to entry through patents and proprietary software code. The company's decades of software development have resulted in extensive patent holdings covering operating systems, productivity applications, cloud services, and emerging technologies like artificial intelligence. Proprietary algorithms, user interfaces, and integration technologies prevent competitors from replicating Microsoft's functionality without significant independent development. The intellectual property moat strengthens through continuous innovation and strategic acquisitions, including partnerships with OpenAI that provide access to cutting-edge AI capabilities integrated across Microsoft's product portfolio.
Switching Costs
Microsoft creates exceptionally high switching costs that lock customers into its ecosystem and generate recurring revenue streams. Switching costs include procedural, financial, and relational costs when organizations consider alternatives. Enterprises with millions of documents in Microsoft formats face substantial conversion challenges, while employee training represents significant time and cost investments. Microsoft's integrated ecosystem across Windows, Office, Azure, and Surface devices creates seamless user experiences that become difficult to replicate with competitor solutions. The subscription model for Office 365 further increases switching costs by embedding Microsoft tools into daily workflows and business processes.
Microsoft holds a very strong competitive moat built on economies of scale, a globally recognized brand, and high switching costs. Its network effects through products like Teams and Office deepen user engagement, while its intellectual property protects core technologies. With a 75% desktop OS market share and trusted enterprise reputation, Microsoft is exceptionally well-defended against competitors.
Revenue growth
$MSFT’s revenue growth accelerated from +7% in Q1 2023 to +18% YoY in Q4 2023, then moderated to +13% in Q1 2025. While Microsoft doesn’t provide revenue guidance for the next quarter, it’s worth noting that the company beat analyst estimates by 2.4% in Q1 — its largest beat in the past six quarters.

Segments and Main Products
Productivity and Business Processes
Microsoft's Productivity and Business Processes segment generates the highest revenue through Office 365 Commercial and Consumer subscriptions, Microsoft Teams, Exchange, SharePoint, OneDrive, Skype, Outlook, and PowerBI. The segment includes Dynamics 365 enterprise resource planning and customer relationship management solutions, plus LinkedIn professional networking services. Office Commercial products, demonstrating strong subscription-based recurring revenue growth.
Intelligent Cloud
The Intelligent Cloud segment encompasses Azure and other cloud services, SQL Server, Windows Server, Visual Studio, System Center, and related Client Access Licenses. Azure revenue grew 32% year-over-year in Q3 2025, with AI services contributing significantly to growth acceleration. The segment includes hybrid cloud solutions, developer tools, and enterprise services that support digital transformation initiatives across organizations of all sizes.
More Personal Computing
More Personal Computing includes Windows operating systems, devices like Surface computers and accessories, Xbox gaming hardware and software, and search advertising through Bing. Windows Commercial products and cloud services generated substantial revenue, while Xbox content and services showed strong performance. The segment also encompasses Microsoft's advertising business and consumer-focused hardware products that extend the Microsoft ecosystem into personal computing environments.
Emerging AI Integration
Microsoft integrates artificial intelligence capabilities across all segments through partnerships with OpenAI and proprietary AI development. Copilot AI assistant enhances productivity applications, while Azure AI services provide enterprise-grade machine learning and cognitive services. AI integration represents Microsoft's strategic focus on maintaining competitive advantages and driving future growth across existing product portfolios.
Main Products Performance in the Last Quarter
Let’s examine $MSFT’s revenue structure by segments. The Productivity and Business Processes segment delivered $29.94B in revenue (+10.4% YoY) with a standout 58.0% operating margin, up +2.2pp YoY.
Intelligent Cloud continues to be a growth engine, posting $26.75B in revenue (+20.8% YoY) and accounting for 38.2% of total revenue. However, operating margin in this segment slipped -1.5pp YoY to 41.5%, due to strategic investments in AI and infrastructure.
More Personal Computing showed modest strength, with revenue growing +6.1% YoY to $13.37B and a notable margin expansion of +3.2pp, now at 26.4%.

$MSFT’s main Product Growth Trends
Azure & other cloud services continued to lead, growing +33% YoY, accelerating from +31% in the previous quarter and well ahead of total revenue growth. It remains Microsoft's strongest engine, consistently compounding in the 29–33% range over the past year.
Search and news advertising also maintained momentum, up +21% YoY in Q1, holding steady QoQ. This segment has shown acceleration since early 2023, reflecting growing ad demand and possibly AI integration into Bing.
Server products and cloud services grew +22% YoY, slightly improving from Q4 but off peak levels seen in mid-2023. While healthy, growth appears to be stabilizing.
Dynamics 365 slowed to +16% YoY, down from +19% in Q4 and well below its 2023 highs of 25–28%.
Microsoft 365 Commercial saw +11% YoY growth, the lowest in over two years, pointing to some deceleration.
LinkedIn posted +7% YoY, continuing its downtrend from double-digit growth just two quarters ago.
Azure and ad revenue are driving the outperformance. Productivity apps and enterprise tools are moderating. Microsoft remains strong, but growth is clearly becoming more concentrated around cloud and AI-adjacent segments.

$MSFT Detailed Breakdown of Segment Performance
Productivity and Business Processes
Revenue reached $29.9B, up 10% YoY (13% in constant currency). Growth was led by LinkedIn, Microsoft 365, and Dynamics 365. LinkedIn revenue rose 7%, with user engagement growing across video and comments. Dynamics 365 revenue rose 16%, gaining share from legacy players like Avaya and SoftCat. Verizon selected Dynamics 365 Sales. Success continues in healthcare and manufacturing verticals, but hiring market weakness persists for LinkedIn's Talent Solutions.
Microsoft 365 and Copilot
Microsoft 365 commercial cloud revenue grew 12% (15% in constant currency). 430M+ paid seats, up 7% YoY. SMBs and frontline workers drove seat growth. Copilot adoption up 3x YoY. 230,000+ organizations use Copilot Studio, with 1M+ custom agents created this quarter alone. Microsoft is layering agents across departments—Sales, Customer Service, Financial Approvals—with deep reasoning, low/no-code extensibility, and document processing capabilities.
GitHub
15M+ GitHub Copilot users, up 4x YoY. GitHub continues to evolve from pair programming into autonomous agent execution. New agent mode in VS Code, along with Code Review Agent and Autofix, expands value across dev lifecycle. GitHub is being adopted by Cisco, HPE, and Target. Microsoft is previewing a SWE agent that can asynchronously execute developer tasks.
Security and Compliance
Security customer base reached 1.4M, with 900K+ using 4+ workloads, up 21%. Microsoft added Security Copilot agents informed by 84T daily threat signals. Identity business (Entra) now has 900M+ monthly active users. EY Global, ManpowerGroup, and TriNet are among the adopters of expanded Defender, Entra, and Purview capabilities focused on AI deployment governance.
Intelligent Cloud
Revenue hit $26.8B, growing 21% YoY (22% in constant currency), outperforming due to Azure. Non-AI services saw accelerated enterprise growth and improving scale motions. On-premise server revenue declined 6%, reflecting the continued cloud shift. Enterprise services rose 5%. Gross margin dropped 4 pts YoY due to AI infra scaling, but operating income rose 17%.
Azure
Azure and other cloud services grew 33% (35% in constant currency). 16 points of growth attributed to AI services. AI capacity was brought online faster than expected, helping Azure outperform. Microsoft anticipates AI-related capacity constraints in Q4 due to surging demand. Postgres usage accelerated for the third quarter; Cosmos DB and Fabric also saw faster growth. Migration workloads from ServiceNow, Coca-Cola, and others contributed to momentum.
More Personal Computing
Revenue reached $13.4B, up 6% YoY. Windows OEM and Devices grew 3%, exceeding expectations amid elevated inventories. Search and news advertising ex-TAC jumped 21%. Gross margin grew 9%, with 21% increase in operating income. Capex efficiency and high-margin prioritization lifted performance. Outlook for Windows OEM includes mid-single digit decline due to expected inventory normalization.
Gaming
Gaming revenue rose 5%, Xbox content and services revenue rose 8%, supported by first-party strength. PC Game Pass revenue surged 45%. Cloud gaming hit a record 150M hours played in the quarter. Microsoft brought Xbox cloud gaming to LG TVs, launched Copilot for Gaming, and introduced Muse model for real-time gameplay generation. Minecraft weekly active users rose 75%+ YoY, aided by movie success.
AI Integration
Microsoft Cloud AI revenue exceeded expectations. Foundry platform processed 100T+ tokens, 5x YoY, and added support for OpenAI, Meta, Cohere, Mistral and more. Phi family of SLMs hit 38M downloads. Microsoft released BitNet b1.58, a CPU-optimized LLM. Real-time intelligence in Microsoft Fabric became the fastest-growing workload. AI-driven features expanded across Microsoft 365, GitHub, Security, and Gaming.
OpenAI Partnership
AI services in Azure were significantly lifted by OpenAI commitments, contributing 16 pts to Azure growth. OpenAI workloads like ChatGPT are deeply integrated into Microsoft’s infrastructure stack. These workloads also drive broader Azure adoption of services like Cosmos DB, PostgreSQL, and storage, building a network effect that elevates overall cloud demand.
Search and Bing
Search and news advertising revenue grew 21% ex-TAC (23% in constant currency), fueled by Copilot Search in Bing and usage from third-party partnerships. Bing and Edge gained share. Innovations like Copilot Vision and Copilot Discover are transforming browsing into a conversational, AI-driven experience. Engagement increased across shopping and planning use cases.
Revenue rose 7% (8% in constant currency). Member engagement is up—video views +36%, comments +32%. Premium Pages for SMBs grew 75% QoQ. Hiring Assistant adoption rose with clients like Verizon and Equinix. AI-powered coaching usage more than doubled QoQ, signaling rising AI adoption for upskilling and recruitment.
Innovation and Product Updates
Microsoft is scaling Copilot agents across all product lines—from Security to Sales, Customer Support, and Work Automation. At the platform level, it has integrated leading LLMs into Foundry, brought new open-source models, and improved fine-tuning tools. GitHub’s shift to autonomous coding agents marks a leap in dev productivity.
In productivity, Microsoft introduced Researcher and Analyst agents inside Copilot for deep reasoning, plus “computer use” agents to automate UI actions. Power Platform users hit 56M MAUs, up 27%, leveraging low-code AI tools to build apps faster.
Capex for the quarter was $21.4B, focused on AI and cloud infra. Nearly half was for long-lived assets supporting future monetization. Free cash flow was $20.3B. Microsoft returned $9.7B to shareholders, up 15% YoY.
Next-gen AI PCs (Copilot+) now include exclusive features like Recall and Click to Do, supporting better performance and battery life. Windows 11 commercial deployments rose 75% YoY as end-of-support for Windows 10 nears.
Revenue by Region
Let’s take a look at $MSFT’s revenue by region. The U.S. remains the largest contributor at 52%, while other countries account for 48%.
Revenue growth in the U.S. accelerated to +15% YoY, outpacing overall growth, while growth in other countries slowed to +12% YoY.

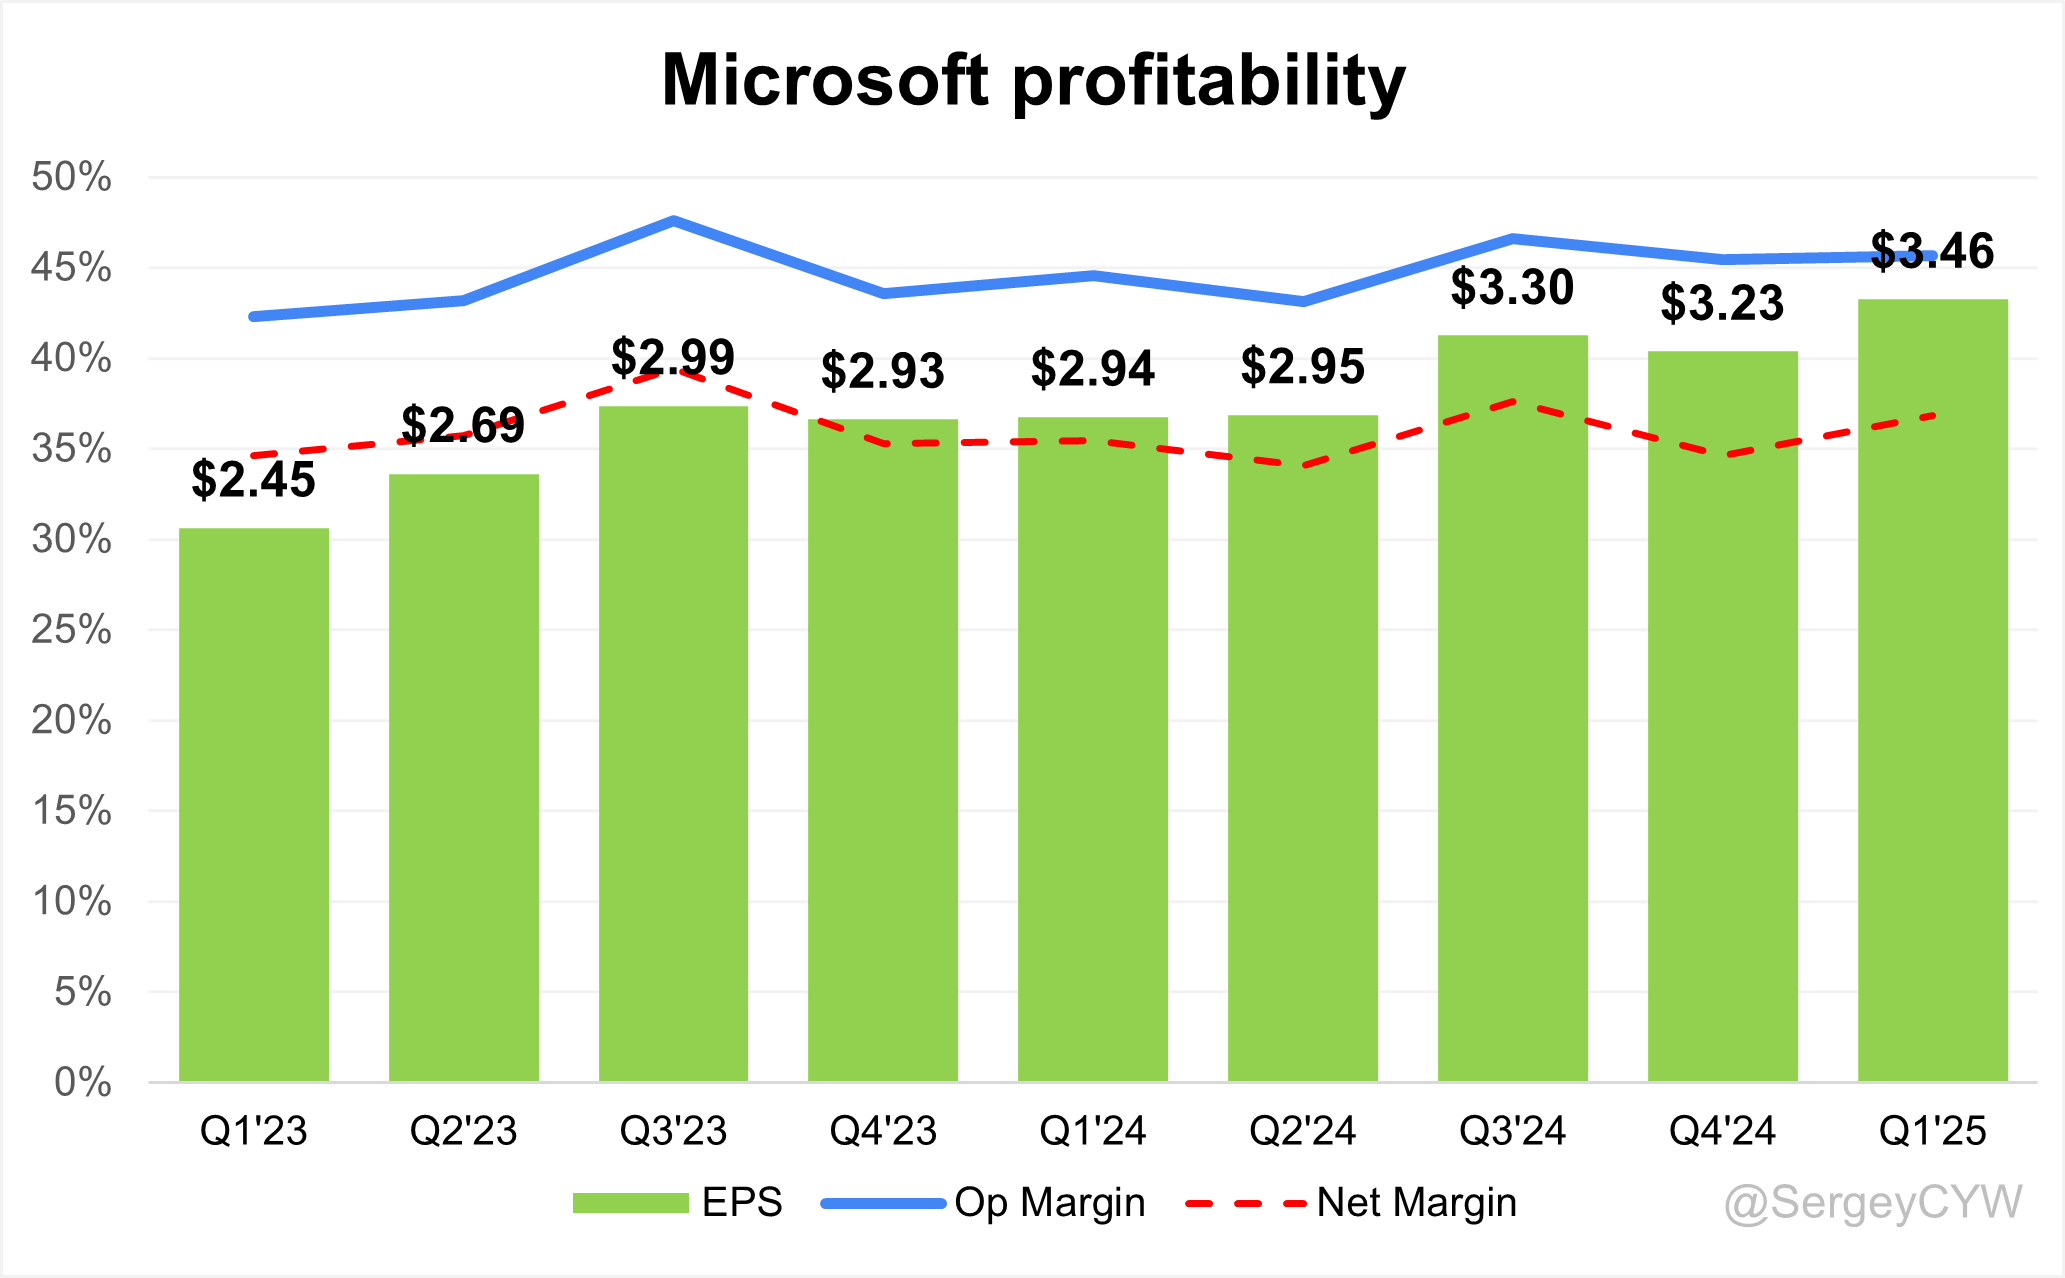
Profitability
Over the past year, $MSFT has improved its margins:
· Gross margin decreased from 70.1% to 68.7%.
· Operating margin rose from 43.5% to 45.7%.
· Net margin increased from 35.3% to 36.9%.
· Free cash flow margin rose from 14.7% to 28.9%.
Operating expenses
$MSFT operating expenses have decreased over the past two years, primarily due to a reduction in S&M spending, which declined from 11% to 9%. R&D expenses also decreased slightly, from 13% to 12%, but remain high as the company continues to invest in future growth. It’s worth noting that R&D spending remains higher than S&M. G&A expenses decreased to 2%.

Balance Sheet
$MSFT Balance Sheet: Total debt stands at $105.0 billion, while Microsoft holds $79.6 billion in cash and cash equivalents, slightly below its liabilities. Elevated spending in recent quarters has been driven by heavy CAPEX investments in cloud and AI infrastructure, as well as shareholder returns. The cash level also declined in Q4 2023 following the completion of the Activision acquisition.

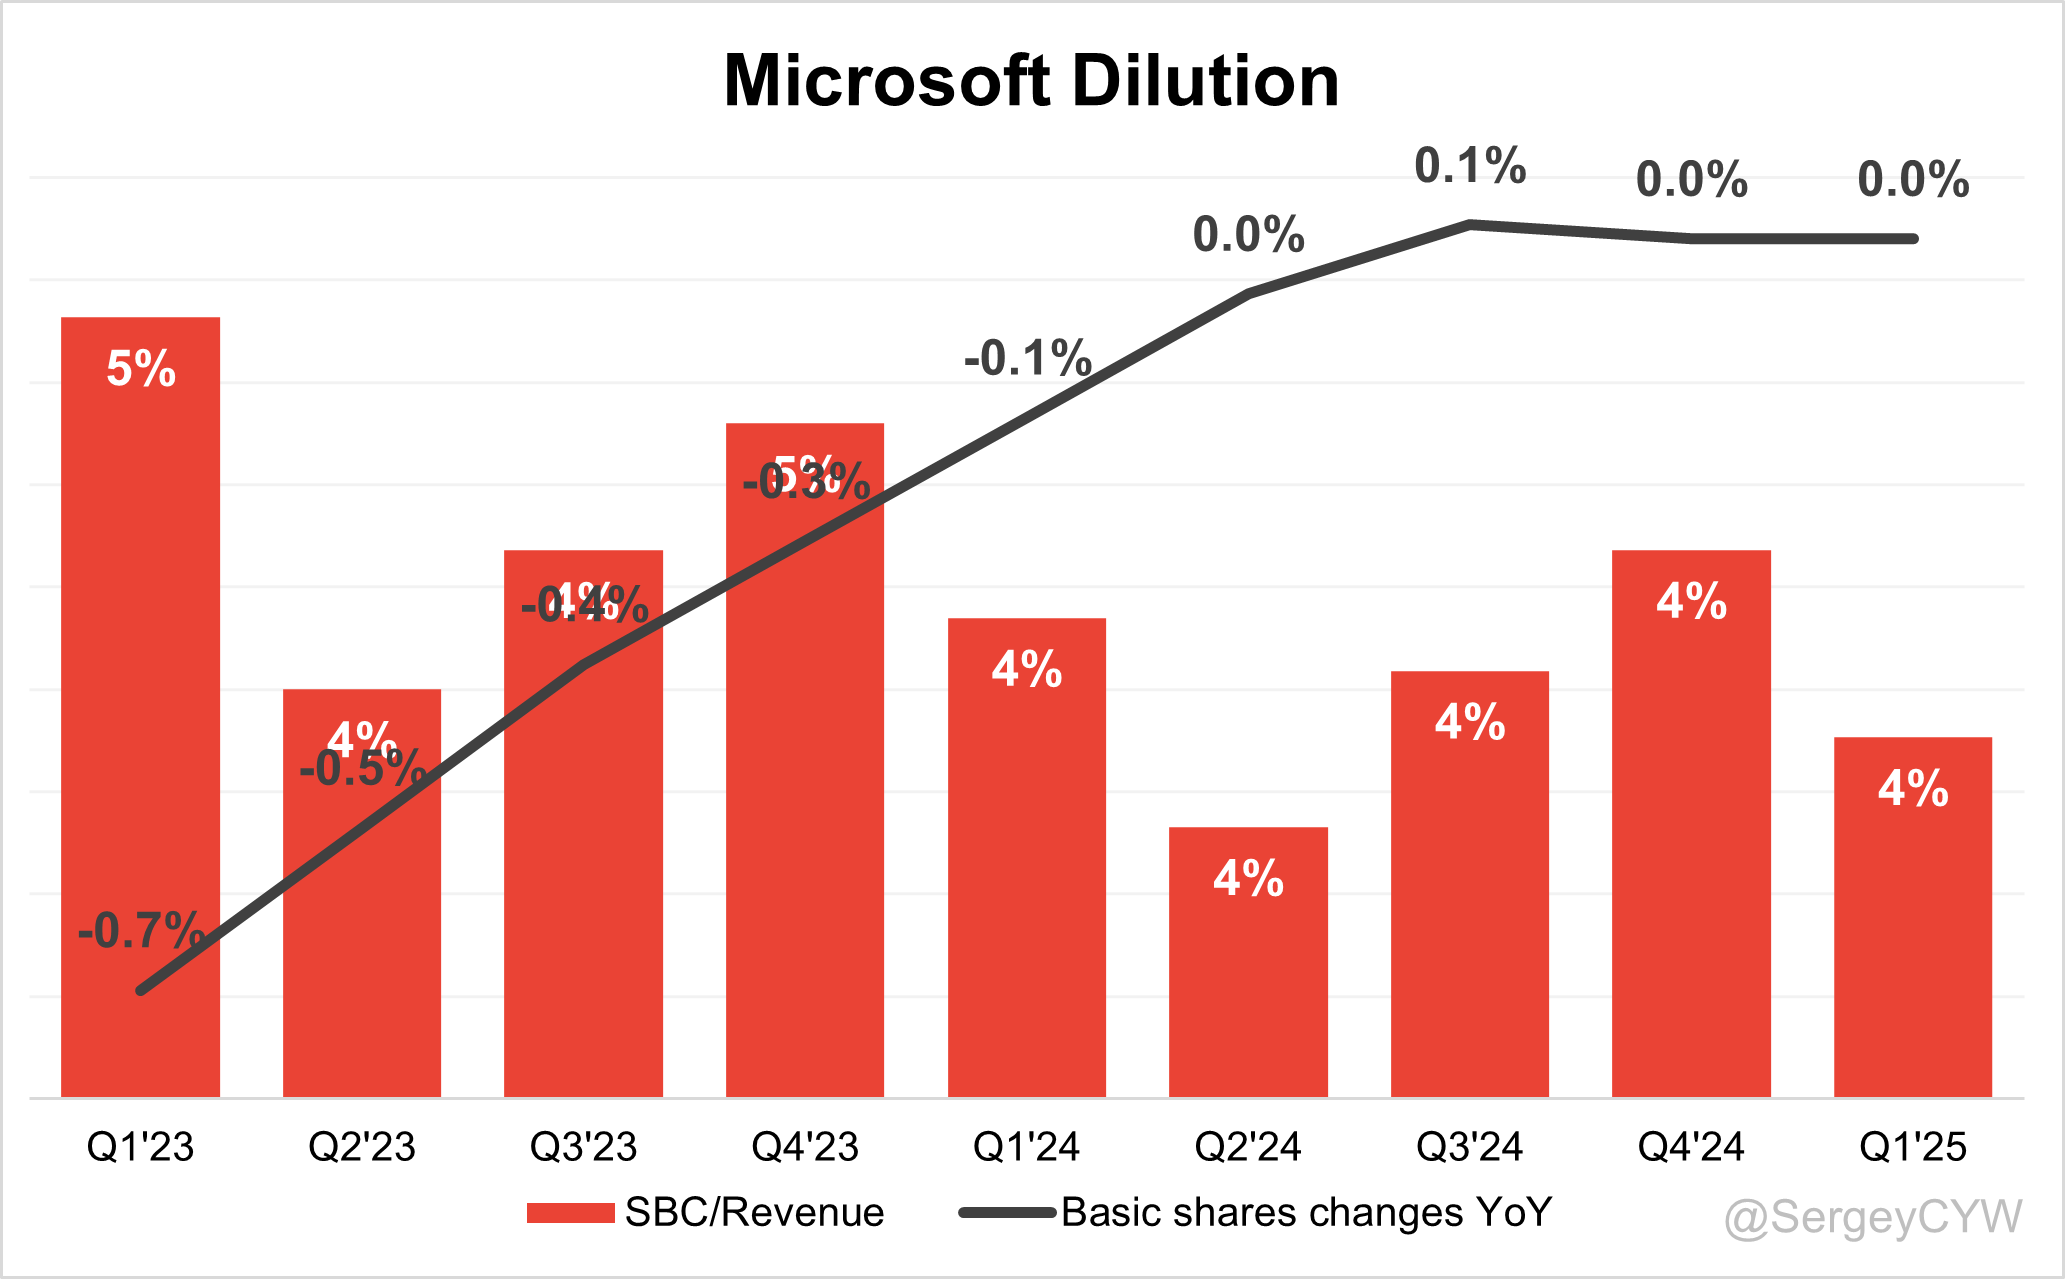
Dilution
$MSFT Shareholder Dilution: Microsoft’s stock-based compensation (SBC) expenses have declined to 4% of revenue, a relatively low level for software companies.
Shareholder dilution remains well-controlled, with the weighted-average number of basic common shares outstanding increasing by just 0.04% YoY. Microsoft continues to return capital to shareholders through a combination of dividends and share repurchases, totaling $9.7 billion in capital returns.
Conclusion
$MSFT has been highly innovative, with significant R&D investments that surpass S&M expenses.
Microsoft holds a very strong competitive moat built on economies of scale, a globally recognized brand, and high switching costs. Its network effects, particularly through products like Teams and Office, deepen user engagement, while its intellectual property protects core technologies.
Microsoft operates a diversified business, with Azure and advertising revenue driving much of the outperformance. AI services in Azure have seen a major boost from OpenAI-related demand, contributing 16 percentage points to Azure’s growth. Azure grew +33% YoY (GAAP) in Q1 — the fastest growth among hyperscalers, outpacing Google Cloud. While productivity apps and enterprise tools are seeing slower growth, Microsoft continues to benefit from its broadly diversified platform, which has proven more resilient than point solutions, especially as customers optimize their IT budgets.
The combined TAM across Microsoft's core segments now exceeds $2 trillion, with cloud and AI services driving the highest growth rates at 16–36% CAGR, respectively.
Revenue growth slightly accelerated to +13.3% YoY in Q1 2025, compared to +12.3% in Q4 2024.
In Q1, Microsoft announced substantial infrastructure investments:
CapEx totaled $21.4B, including finance leases. The spend was roughly split 50/50 between long-lived assets and short-lived components (e.g., GPUs, CPUs). Demand for AI infrastructure continues to outpace capacity, even with accelerated buildouts.
Looking ahead, FY2026 CapEx is expected to grow, but at a slower rate than FY2025.
Valuation is near historical highs based on both forward P/S and forward P/E. However, compared to other Big Tech peers, Microsoft appears fairly valued. Analysts expect accelerating revenue growth, with 2025 forecasts at +15.5% YoY.
On the downside, the only notable concern is the balance sheet, as cash and cash equivalents are slightly below total debt — a point worth monitoring.
Thank you for reading!
Follow me for more frequent updates on X/Twitter and Threads, and on LinkedIn. For visual infographics, check out Instagram, and for portfolio changes, follow me on SavvyTrader.
Disclaimer: This earnings review is for informational purposes only and does not constitute financial, investment, or trading advice.