


Meta Platforms: Global Leader in Social Technology and Digital Advertising
Deep Dive into $META: Valuation, Segment Growth, Key Metrics, Profitability, Expenses, Product Launches, Customer Acquisition, Financial Stability, SBC/Revenue, and Shareholder Dilution.

Meta: Company overview
About Meta
Meta Platforms, Inc., formerly Facebook, is a multinational technology conglomerate headquartered in Menlo Park, California. Founded in 2004 by Mark Zuckerberg, Meta has grown from a single social network into a global digital ecosystem. The company owns Facebook, Instagram, Threads, and WhatsApp, with 3.35 billion daily active users across core products as of Q4 2024.
Meta generates 98.6% of its revenue from its Family of Apps, with 1.5% from Reality Labs. In 2024, the company reported $164.5 billion in revenue, $69.38 billion in operating income, and $62.36 billion in net income. Meta employs 74,067 people and holds a market cap of $1.78 trillion as of April 2025.
Company Mission
Meta’s mission is to connect people, communities, and businesses through innovative social technology. Its vision is to empower individuals and foster meaningful connections through its platforms, helping users thrive personally and professionally. Core values include connection, innovation, diversity and inclusion, integrity, empowerment, and social responsibility.
Sector
Meta operates in the Computer and Technology sector, specifically Internet Software. It is one of the Big Five tech companies, alongside Alphabet, Amazon, Apple, and Microsoft. Meta dominates social media, with Facebook surpassing 3 billion users, and holds a 21% U.S. digital ad market share, behind Alphabet and ahead of Amazon. In 2022, Meta invested $35.3 billion in R&D, ranking third globally.
Competitive Advantage
Meta's strength lies in its network effects, with 3.29 billion daily active users creating powerful entry barriers. Its advertising platform, responsible for 97% of annual revenue, uses advanced machine learning and deep user data to deliver precise ad targeting. Meta processes billions of data points daily and offers cross-platform integration across Facebook, Instagram, WhatsApp, and Messenger. The company’s technological infrastructure is backed by $13.7 billion in AI/ML R&D and $9.5 billion in data center investment, reinforcing its competitive edge.
Total Addressable Market (TAM)
The global digital advertising market is projected to grow from $843.48 billion in 2025 to $1.43 trillion by 2029, with a 14% CAGR. Meta generated $160 billion in ad revenue in 2024, maintaining a 21% U.S. market share.
The metaverse market is estimated at $103.6 billion in 2025, projected to grow at a 37.43% CAGR, reaching $507.8 billion by 2030. User growth is forecasted to rise from 700 million monthly active users to 2.6 billion by 2030.
Valuation
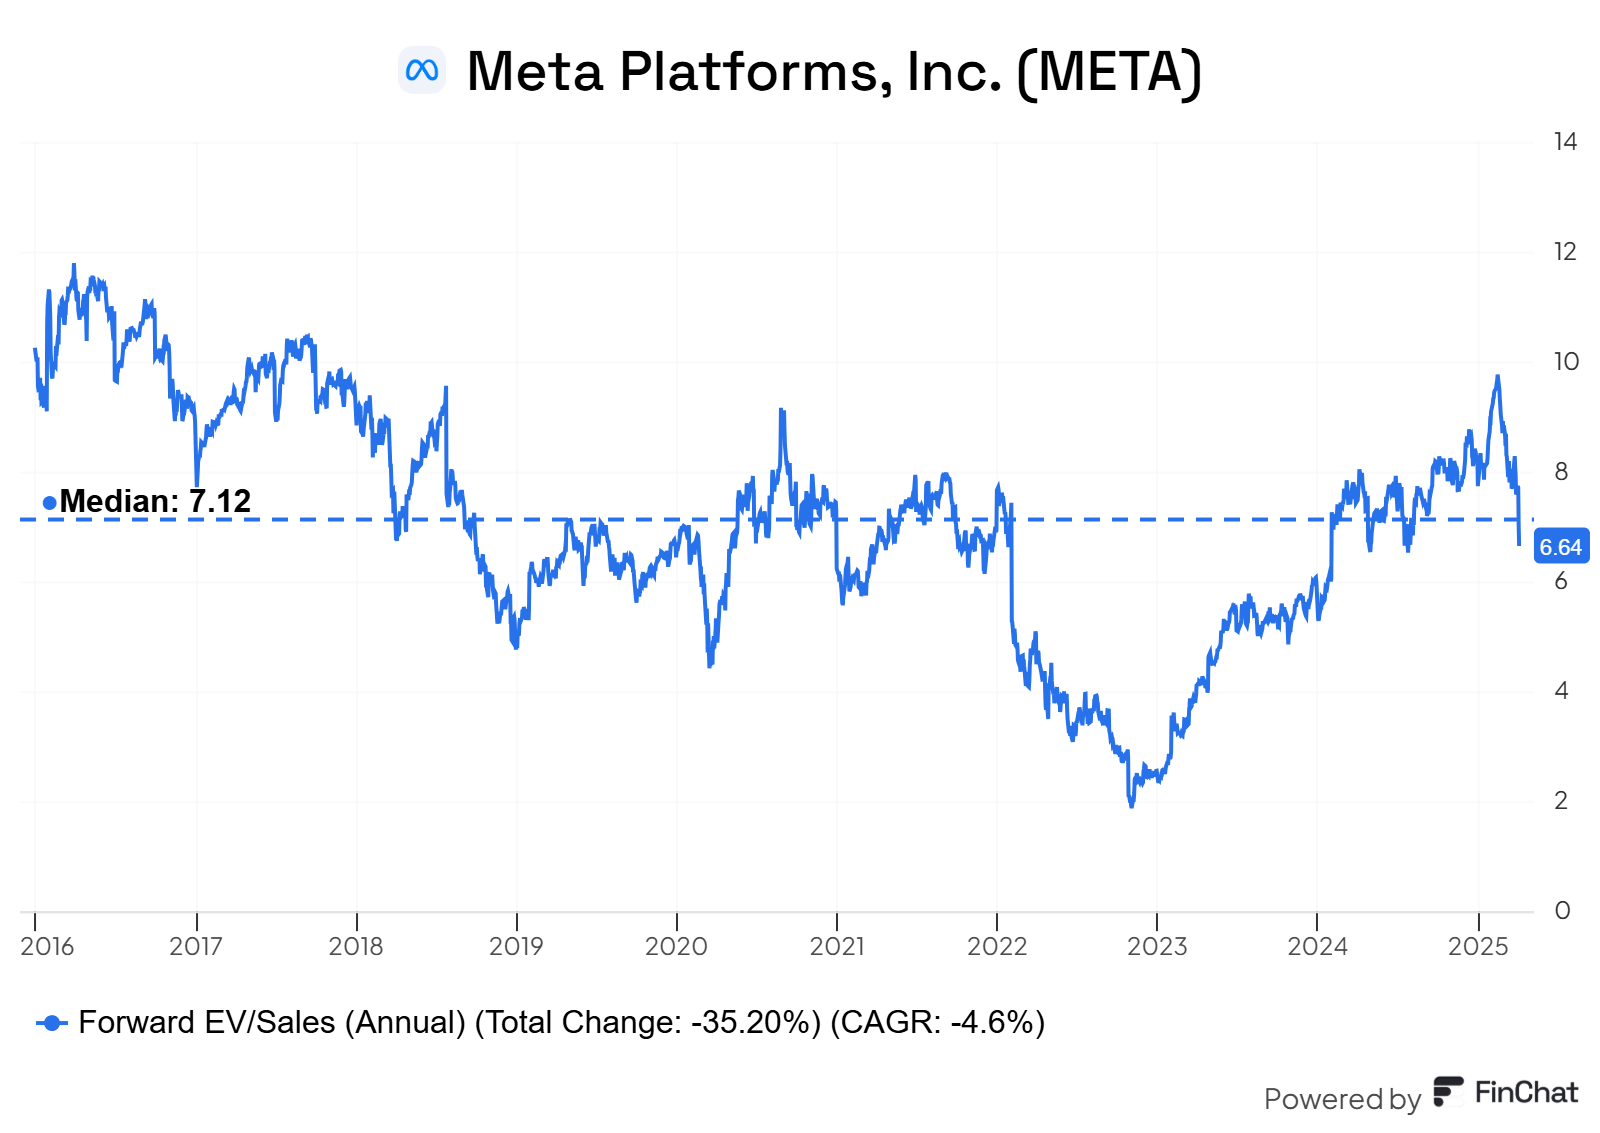
$META is trading at a forward EV/Sales multiple of 6.64, slightly below the median of 7.1. At the end of 2022, the multiple hit a low of 1.9, rising more than threefold to its current level.
$META trades at a forward P/E ratio of 19.9, roughly in line with the median of 19.3, with revenue growth of 21% YoY in the latest quarter.
The EPS growth forecast for 2026 is 14.6%, with a P/E of 19.4, resulting in a 2026 PEG ratio of 1.3.
For 2027, EPS growth is projected at 16.5%, with a P/E of 16.9 and a 2027 PEG ratio of 1.0.

The PEG (Price/Earnings to Growth) ratio is a key tool for evaluating growth stocks, introduced by Peter Lynch.
PEG < 1: Undervalued – A ratio below 1 suggests the stock is undervalued. For example, if the P/E is 15 and earnings are expected to grow by 20%, the PEG would be 0.75, indicating a good buying opportunity.
PEG = 1: Fair Value – A PEG of 1 means the stock price matches its growth expectations, representing fair value.
PEG > 1: Overvalued – A PEG above 1 indicates the stock may be overvalued, as its price is higher than its projected growth rate, making it riskier.
Valuation comparison
Analysts forecast $META revenue growth of +16.9% in 2025 and +13.5% in 2026. Based on this outlook, the valuation using the P/S multiple appears to be trading at a premium compared to other companies in the Digital Advertising sector.

Analysts expect solid revenue growth, so let's examine the key metrics to determine whether these expectations are justified.
We'll evaluate the company's economic moat, which supports long-term revenue growth, analyze revenue trends and the forecast for next quarter, and identify key factors that could help the company exceed expectations and sustain future growth.
We'll assess the performance of key segments, the launch of new products and updates, customer acquisition growth, key financial metrics, financial stability, and margin trends.
Additionally, we'll review the SBC/Revenue ratio, shareholder dilution, and finally, draw conclusions on the company's outlook.
Economic Moat
Meta’s moat is driven by exceptional scale and network effects. With over 3 billion users, it enjoys very strong economies of scale and self-reinforcing network effects that make its platforms more valuable with each new user. Its strong brand is globally recognized, while its intellectual property secures its lead in AI and content delivery. Switching costs are moderate, offering some user retention, though not a major barrier. Overall, Meta’s competitive edge is built on platform dominance, data scale, and innovation.
Economies of Scale
Meta benefits from significant economies of scale in its advertising business. With nearly 3 billion daily active users, the company spreads fixed costs across a massive base, maintaining high profitability while investing in new technologies like the metaverse. This scale enables competitive pricing in digital advertising and reduces the average cost per user. Meta’s cost-efficient structure is difficult for smaller players to replicate. As its user base expands, its platforms become more valuable to advertisers.
Strength: Very Strong — Meta’s massive scale creates enduring cost advantages.
Network Effect
Meta’s most powerful moat is its network effect, with 3.35 billion daily active users across Facebook, Instagram, WhatsApp, and other platforms. Each new user increases the value for all others, reinforcing user engagement and advertiser appeal. In emerging markets, Meta often serves as a primary internet gateway, further entrenching its position. Barriers to entry are exceptionally high.
Strength: Exceptional — Meta’s ecosystem grows stronger with every user, making it nearly impossible to replicate.
Brand Strength
Meta’s brand is synonymous with social media. Platforms like Facebook and Instagram are global staples, driving user retention and advertiser trust. Despite reputational issues related to privacy, Meta’s products remain deeply embedded in modern communication, business, and content sharing.
Strength: Strong — The brand is resilient and continues to command loyalty from users and advertisers alike.
Intellectual Property
Meta holds a vast portfolio of patents that protect its technology across advertising, content delivery, and AI. Patents on ad targeting, news feed algorithms, and image recognition systems offer a critical edge in efficiency and user experience. These IP protections support continued investment in AI and machine learning, while creating barriers for smaller competitors.
Strength: Strong — Its IP portfolio protects core tech and enables innovation in emerging markets like the metaverse.
Switching Costs
Meta’s platforms carry moderate switching costs. Users risk losing access to years of content, social connections, and daily interactions if they leave. This friction provides some defense against churn, though it's not insurmountable. The rise of platforms like Snapchat and TikTok shows users are willing to diversify.
Strength: Moderate — Switching is possible, but the cost in lost content and connections discourages it.
Revenue growth
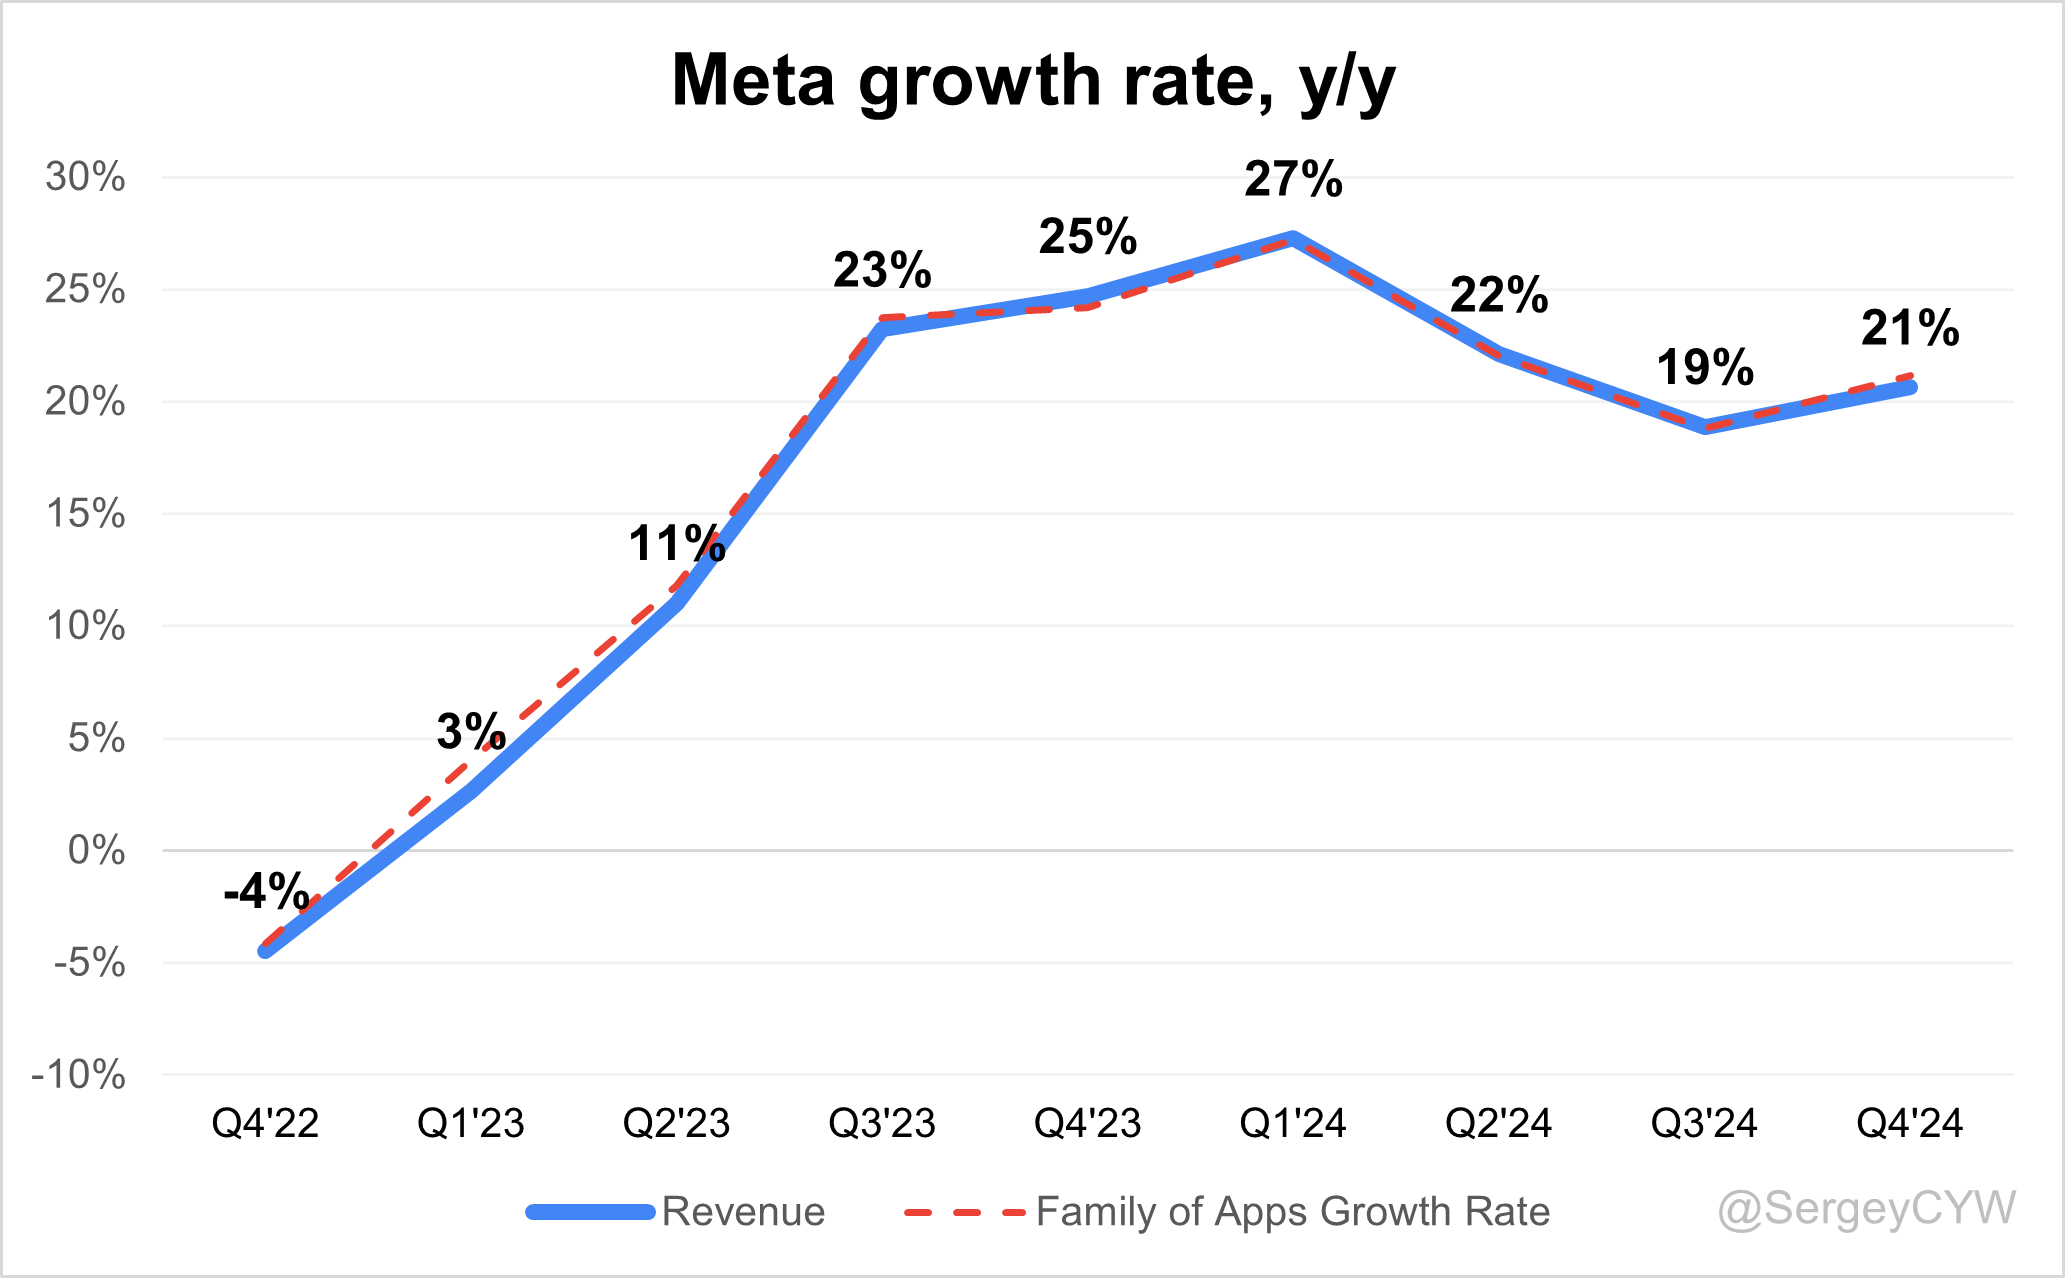
$META's revenue growth accelerated from -4% in Q4 2022 to +27% YoY, then moderated to +21% in Q4 2024, also showing an improvement compared to +19% in Q3.
If the company exceeds its forecast by 0.8%, as it did in Q4, Q1 2025 revenue growth would reach 15.6%, suggesting a potential further slowdown in growth.
Segments and Main Products
Family of Apps
Meta's Family of Apps includes Facebook, Instagram, Messenger, and WhatsApp, generating 98.1% of total revenue, primarily through advertising. Facebook connects billions globally through social features like Marketplace and Watch. Instagram drives product discovery and brand engagement through visual content. WhatsApp is the most-used messaging app globally, while Messenger dominates North America. In 2024, the segment generated $162.4 billion in revenue, with $160 billion from advertising.
Reality Labs
Reality Labs develops Meta's AR/VR hardware, software, and content, including Meta Quest and Ray-Ban Meta smart glasses. In 2024, the segment posted $2.1 billion in revenue and an operating loss of $17.7 billion, yet Meta continues to invest. The division held a 73% global market share in VR/mixed-reality headset shipments and grew sales by 40% YoY. It represents Meta’s long-term bet on the metaverse, which has 700 million monthly active users, projected to reach 2.6 billion by 2030.
Meta AI
Meta AI is the company’s advanced conversational assistant, reaching 700 million monthly active users as of January 2025. WhatsApp leads in usage, with India being the largest market on Instagram and WhatsApp. Meta expects AI users to exceed 1 billion by end of 2025. Infrastructure plans include 2GW of compute capacity and deployment of over 1.3 million GPUs, with $60–65 billion in capital expenditures projected for 2025.
Main Products Performance in the Last Quarter
Let’s examine $META’s revenue structure by segments. The Family of Apps segment generates 98% of the company's revenue, while Reality Labs contributes 2%. Next, we’ll take a closer look at the revenue growth and operating margin trends for these two segments.

$META's Family of Apps revenue growth accelerated from +19% YoY in Q3 to +21% in Q4 2024. The operating margin increased significantly, reaching 60%, remaining near a record high for the company.

Reality Labs' revenue grew by +1% in Q4, this segment remains highly unprofitable for $META. Despite generating $1,083 million in revenue, the operating loss amounted to $4,967 million.

Family of Apps
Daily active users surpassed 3.3 billion, driven by growth across Facebook, Instagram, and WhatsApp. Q4 revenue reached $47.3B, up 21% YoY, signaling strong engagement and monetization. Growth was supported by increased video consumption, especially in the U.S., where video time on Facebook and Instagram rose by double digits YoY. Meta is prioritizing content discovery tools and creator tools like the new app “Edits” to improve video content creation and performance.
WhatsApp & Threads
WhatsApp continues to expand in the U.S. with over 100 million MAUs, gaining traction as a preferred messaging platform. Strong Meta AI integration is enhancing engagement, particularly in information-seeking and emotional support queries. Threads crossed 320 million MAUs, with over 1 million sign-ups per day. Meta began testing ads on Threads, but monetization impact is expected to be immaterial in 2025. Threads is investing in feed personalization and discovery, aiming to become the leading public conversation platform.
Ad Revenue
Ad revenue rose 21% YoY to $46.8B in Q4. Strength was led by online commerce, with pricing up 14% and impressions up 6%. Rest of World delivered the fastest growth at +27%, followed by Asia-Pacific (+23%) and Europe (+22%). North America lagged with +18% growth. Meta highlighted Andromeda, a new ML system developed with Nvidia, enabling 10,000x model complexity and driving +8% improvement in ad quality. Generative AI tools saw rapid adoption, with 4M+ advertisers using Meta’s AI ad creative tools, up from 1M six months ago.
Reality Labs & Metaverse
Q4 revenue was $1.1B, flat YoY. Expenses reached $6B, resulting in a $5B operating loss. Growth in user engagement for Quest and Horizon continues, with 2025 expected to clarify whether AI glasses can become a major consumer electronics category. Meta is investing in more visually stunning and inspiring experiences to drive adoption. Success of Ray-Ban Meta AI glasses is seen as a positive signal.
Meta AI
Meta AI now reaches 700 million monthly users. Most engagement occurs via WhatsApp, especially for education, emotional support, and information queries. On Facebook, Meta AI is increasingly used to explain content in the feed. Personalization is a priority in 2025—Meta AI will begin remembering preferences and behaviors across apps to refine responses. Monetization isn’t expected this year. Future potential includes paid recommendations and premium tiers, but the focus remains on expanding usage.
Llama 4
Llama 4 will be a multimodal, omni-model with agentic capabilities. Llama 4 mini has completed pretraining, and larger reasoning models are progressing well. Meta’s goal is for Llama 4 to lead the open-source frontier in AI after Llama 3 made open-source competitive with closed models. Mark Zuckerberg reiterated the long-term strategic value in driving global open-source standards with U.S. leadership, especially amid rising competition from Chinese labs like DeepSeek.
Innovation & Product Updates
Meta is launching a standalone Reels creative app “Edits”, new creator-first discovery features, and expanding Reels reshare features to drive engagement. Advantage+ Shopping surpassed a $20B run rate, up 70% YoY, with new campaign flows making automation the default. The Meta AI coding assistant is already enhancing internal developer productivity. Future plans include automated code generation to improve product development velocity.
Revenue by Region
Let’s examine $META’s revenue by region. The largest contributor is the US & Canada, accounting for 45% of total revenue, followed by Europe at 24%. Asia-Pacific contributes 19%, while the Rest of World accounts for 12% of total revenue.
Meta revenue growth across all regions increased in Q4 compared to Q3 2024. Notably, smaller regions are growing faster than the largest region, US & Canada. In Q4, growth rates were: US & Canada +17% YoY, Europe +22%, Asia-Pacific +23%, and Rest of World +28%.

Key Metrics
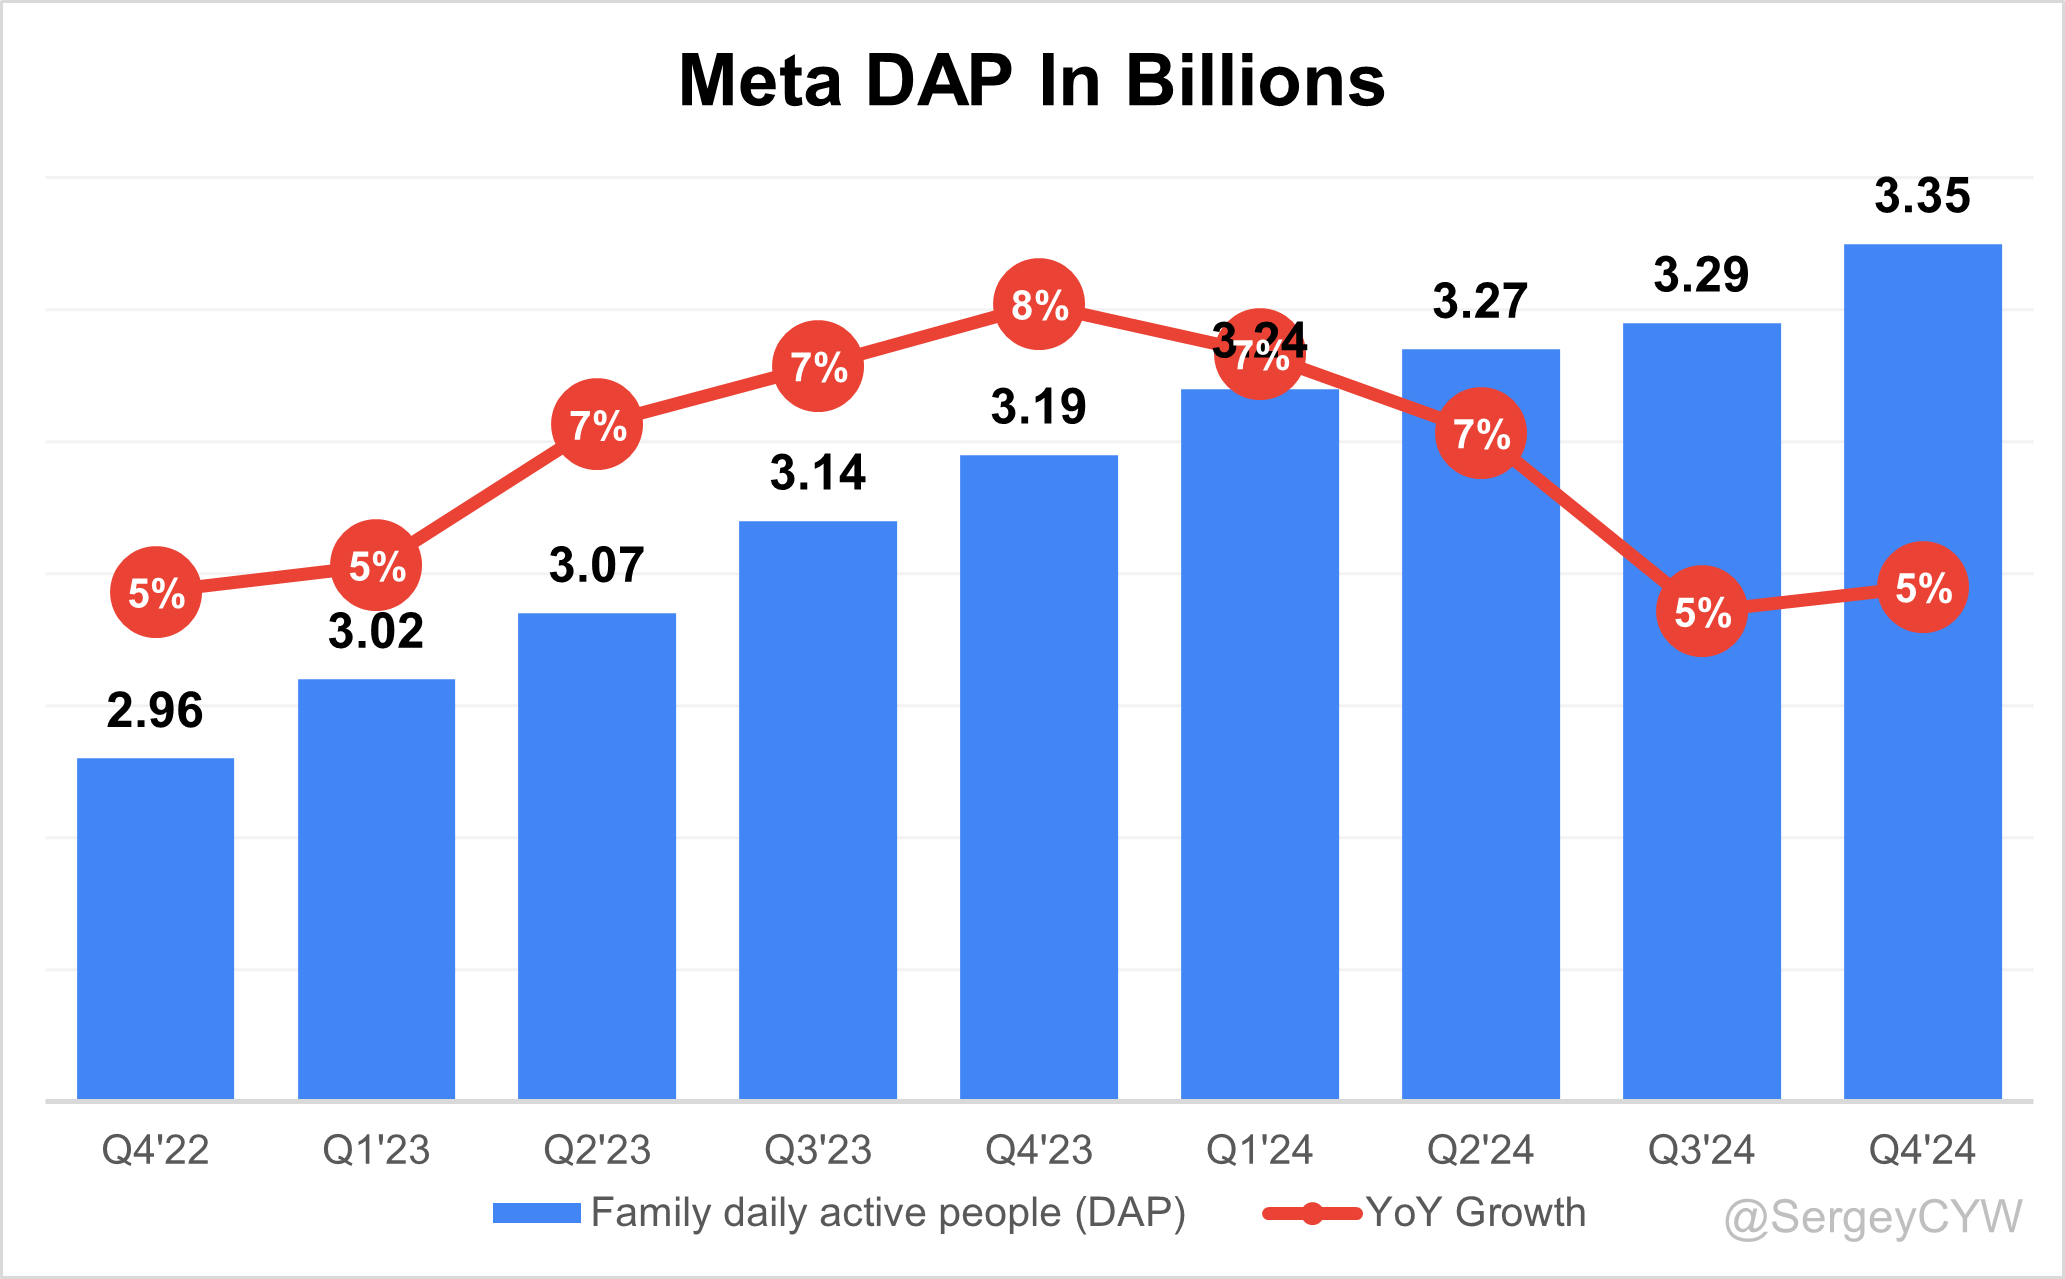
$META's Family daily active people (DAP) reached a record high of 3.35 billion in Q4, representing a 5% YoY growth.
User Growth
Meta’s user base continued to expand across all platforms.
Facebook alone remains a dominant presence with over 3 billion MAUs. Growth was broad-based, including global and U.S. markets. WhatsApp maintained global leadership in messaging, while Meta AI engagement also contributed to expanding the user base, particularly on WhatsApp and Facebook.
Meta's multi-platform strategy continues to deliver consistent user growth, reflecting high retention and improved discoverability of newer services like Meta AI and Threads.
User Engagement
Engagement deepened across formats and regions. Video consumption increased by double digits YoY on both Instagram and Facebook, with U.S. users showing particularly strong growth. Reels resharing exceeded 4.5 billion times per day, indicating sustained interaction and social virality.
On WhatsApp, Meta AI drove repeat usage, especially around information queries and emotional support. Facebook saw meaningful interaction via its Meta AI feed integration, offering content-related queries that prompted deeper session times. Threads is prioritizing custom feed features and real-time updates to improve stickiness and drive longer engagement windows.
Creators are playing a pivotal role in engagement dynamics. Instagram introduced tools allowing creators to test Reels with non-followers before broader distribution. Early signs suggest this is expanding reach and increasing time spent across sessions. The upcoming “Edits” app is expected to further boost mobile content creation.
Meta’s AI-driven content personalization, infrastructure improvements, and toolkits for creators are increasing average time spent per user. New monetizable surfaces like Threads are still early but are being positioned for future engagement monetization.
$META's Family Average Revenue per Person (ARPP) reached a record high of $12.33 in Q4, matching the level from Q4 2023, reflecting 0% YoY growth.

Profitability
Over the past year, $META has improved its margins:
· Gross margin increased from 80.8% to 81.7%.
· Operating margin rose from 40.8% to 48.3%.
· Net margin increased from 34.9% to 43.1%.
· Free cash flow margin slightly decreased from 28.6% to 28.0%.

Operating expenses
$META Non-GAAP operating expenses have decreased, primarily due to a reduction in S&M spending, which declined from 14% to 7%. R&D expenses dropped from 30% to 25%, but remain high as the company continues to invest in future growth through platform enhancements and updates. It's important to note that R&D spending remains higher than S&M. G&A expenses decreased to 2% in Q4 2024, (fourth quarter 2024 general and administrative expenses include a favorable impact of $1.55 billion due to a decrease in the accrued losses for certain legal proceedings).

Balance Sheet
META Balance Sheet: Total debt stands at $49.8 billion, while Meta holds $77.8 billion in cash and cash equivalents, far exceeding its liabilities and reflecting a healthy balance sheet.

Dilution
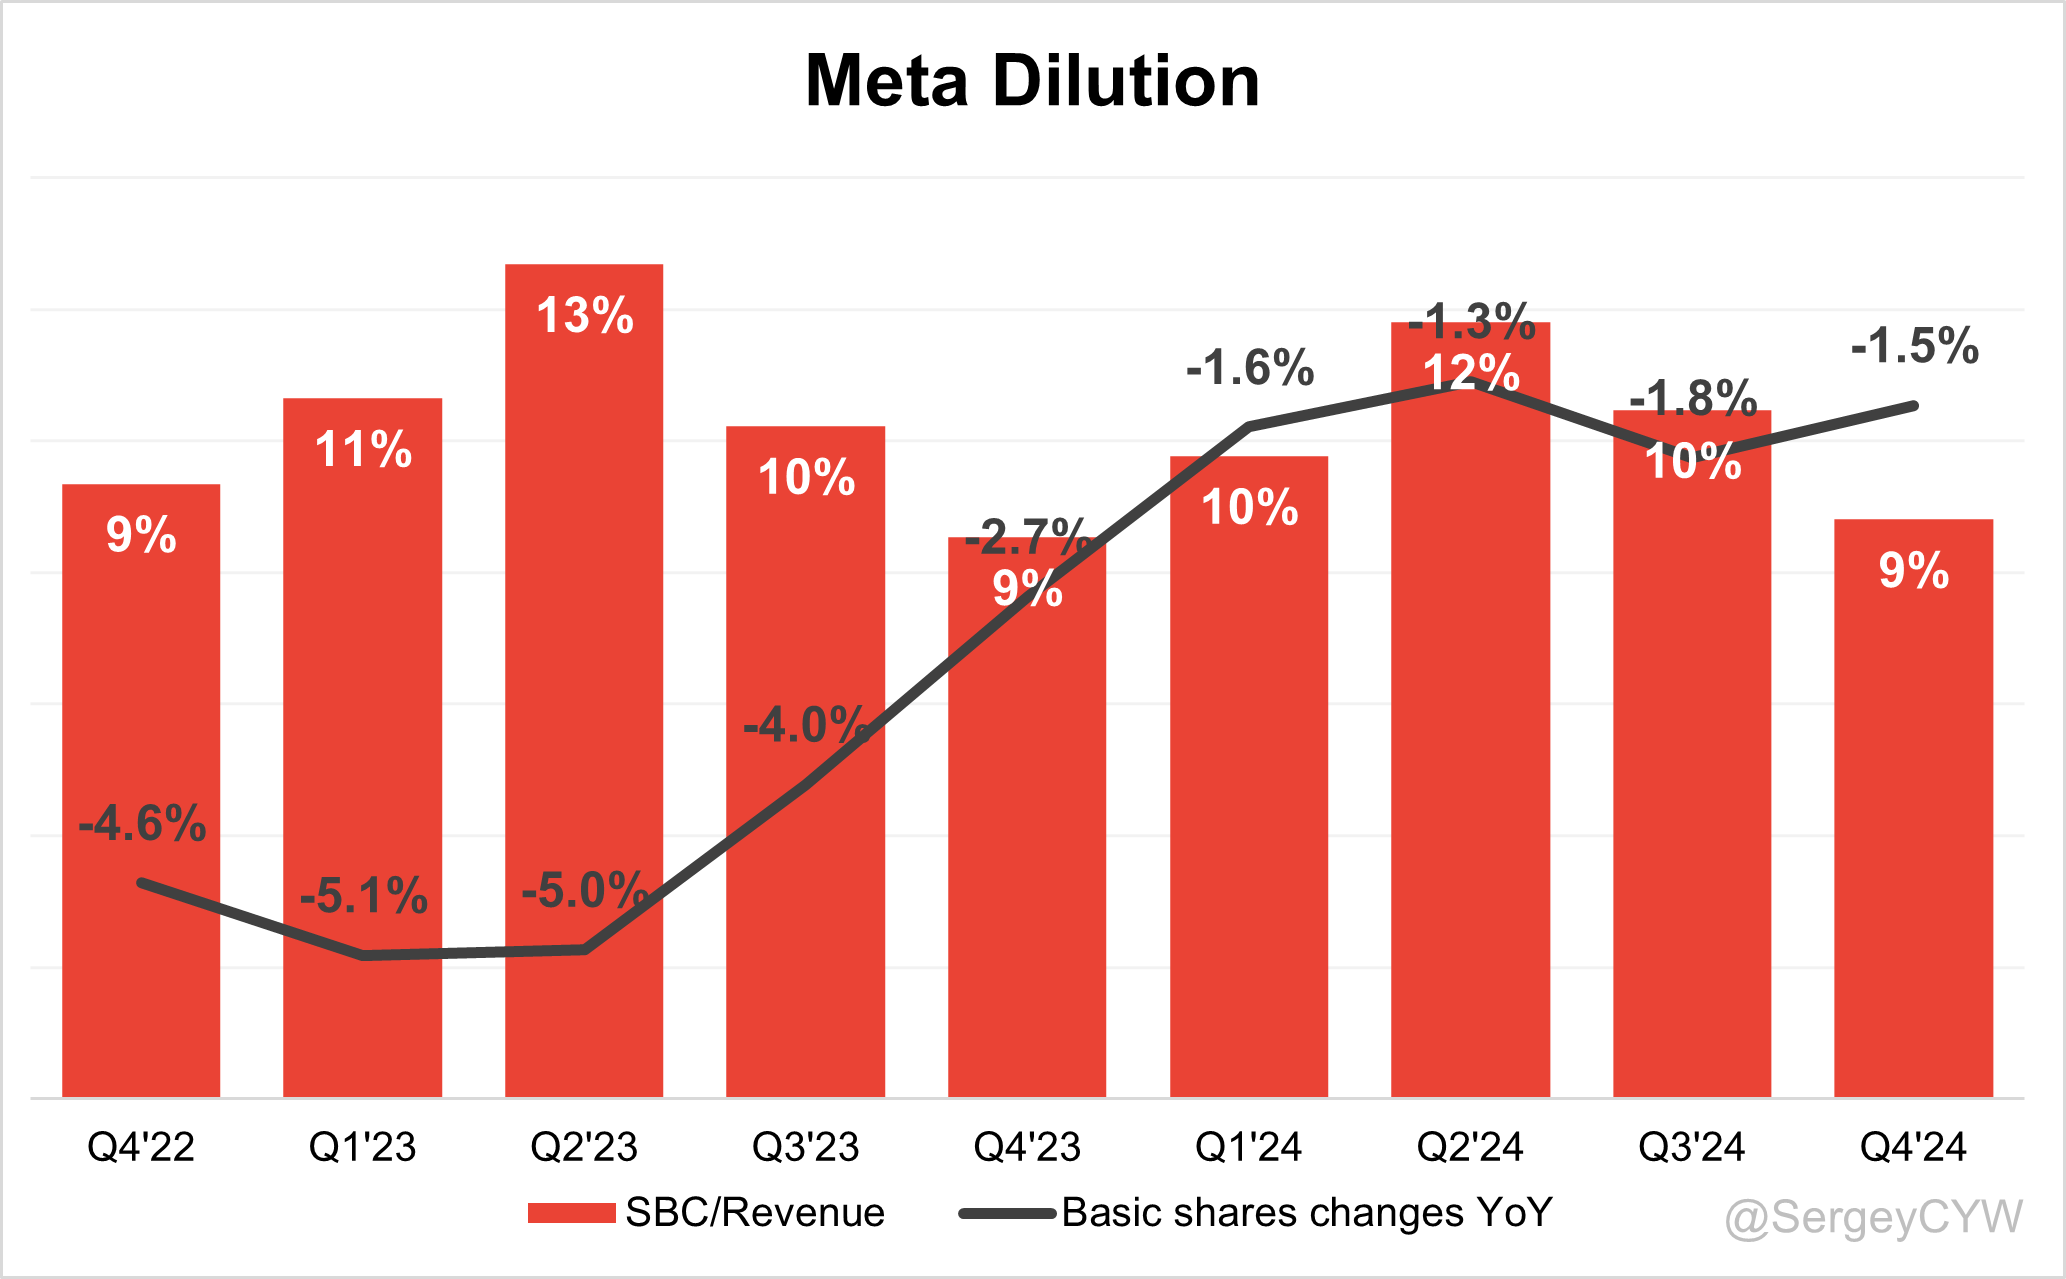
$META Shareholder Dilution: Meta’s stock-based compensation (SBC) expenses have declined to 9% of revenue, a low level for SaaS companies.
Shareholder dilution remains well-controlled, with the weighted-average number of basic common shares outstanding decreasing by -1.5% YoY. Meta continues to return capital to shareholders through share repurchases and its dividend program. In Q4 2024, the company returned $1.3 billion in dividends.
Conclusion
$META has been highly innovative, with significant R&D investments that surpass SG&A expenses. The Reality Labs division is relatively new, and the company is actively investing in virtual and augmented reality, which could become a key future growth driver. The metaverse market is estimated at $103.6 billion in 2025 and is projected to grow at a 37.43% CAGR, reaching $507.8 billion by 2030.
Revenue growth accelerated to +20.6% YoY in Q4 compared to Q3, though the forecast for next quarter suggests a notable slowdown.
In Q4, Meta announced substantial infrastructure investments to support AI development, with plans for increased CapEx in 2025 to advance AI research and product innovation. Capital expenditures for Q4 2024 totaled $14.8 billion, driven by higher spending on servers, data centers, and network infrastructure.
Meta’s LLM, Llama, is rapidly evolving and gaining traction.
International growth remains strong, with smaller regions outpacing growth in the U.S. and Canada.
Key metrics:
Family Daily Active People (DAP) reached a record 3.35 billion, up +5% YoY
Family Average Revenue per Person (ARPP) hit a record $12.33
These strong user and monetization figures support the stabilization of revenue growth.
Valuation is near the median on both forward P/S and forward P/E. Compared to peers in the digital advertising sector, Meta trades at a slight premium, which is justified by its strong balance sheet and competitive positioning.